
Drought & Precipitation
Colorado is off to an unusually poor start this winter. Statewide snowpack is tracking at its lowest relative level for late November in about three decades. A number of northwest basins are barely above 20 percent of average, and areas along the I-70 corridor are seeing similarly weak early-season totals. Early-season numbers can shift quickly, but this thin base reflects the warm and dry pattern that dominated late summer and fall. The US Drought Monitor classifies small portions of the Arkansas River Basin as moderate drought, with most of it classified as mild drought or no drought (figure 1).

figure 1: Colorado Drought Monitor

Snowpack
A late-November storm helped ease the effects of the dry month. The November 30 storm brought 1–6 inches of snow to the northern mountains, 5–13 inches to the central mountains, and 6–11+ inches to the southern mountains. After this storm, the Arkansas River Basin’s snow water equivalent sits at 58% of the seasonal average (figure 3).
Even with the slow start, November snowpack does not determine the full trajectory of the winter, since most of Colorado’s snow typically falls between December and March. Past years have shown that dry Novembers can be followed by stronger snowfall later in the season. According to the USDA Snow Survey, above-normal snowfall will be needed through the rest of winter to make up ground. An October storm provided a helpful bump, bringing statewide precipitation to about 92 percent of median. Without that event, totals would be closer to 40 percent.

November Precipitation Totals
Leadville-0.36 in
Buena Vista-0.22 in
Salida-0.63 in
Cañon City-0.36 in
Pueblo -0.99 in
Rocky Ford-0.22 in
Lamar-0.59 in

figure 4: Colorado statewide Water Year Precipitation anomaly

figure 5: Departure from Normal Precip
Soil Moisture
Much of the state received below-normal precipitation through late summer and early fall, leaving soil moisture near to slightly below average across the basin(figure 4). The worst drought conditions were observed about 12 weeks ago, especially on the West Slope, but gradual improvements have emerged since late August (figure 2). Southwestern Colorado saw a notable recovery in October. In contrast, parts of eastern Colorado slipped into deeper dryness this fall, with some locations recording no measurable precipitation through mid-November.
Compared with last year, drought patterns have essentially reversed. The West Slope was healthier at this time in 2024, while eastern Colorado was drier. The current Standard Precipitation Index values show lingering long-term deficits west of the Continental Divide despite recent improvements, while the eastern plains retain better long-term moisture (figure 7).

figure 6: 1-Meter Soil Moisture

figure 7: 60 Day Standard Precipitation Index
Why focus so much on autumn soil moisture?
This time of year, climatologists are looking at soil moisture, particularly high elevation west of the divide, because if you have wetter than normal soil moisture conditions, then when your snow melts in spring, less of the snowmelt will go into recharging soil moisture and more can run off into lakes, streams, and reservoirs. If soils are drier, we lose more of that water to recharging soil moisture. For the most part, what we see is a more optimistic picture than we have seen in recent years, but we still need a good snow year to have a good runoff year.
Terrestrial water storage, which includes soil moisture, groundwater, snowpack, and canopy moisture, remains lower than historical norms across much of eastern Colorado. This continues a decades-long trend toward reduced water storage (figure 8).

figure 8: Terrestrial Water Storage
Temperature Trends
It has been a very balmy autumn thus far, even by recent standards. October was 2.9 degrees Fahrenheit warmer than the 1991-2020 normal, and our early November anomaly was even greater. According to the Colorado Climate Center, most of the state was 6 degrees above normal for the first half of the month.

figure 9: Departure from Normal Temperature

figure 10: Colorado Statewide Water Year Temperature Anomaly
Streamflow

figure 11: Map of 28-day average streamflow compared to historical median
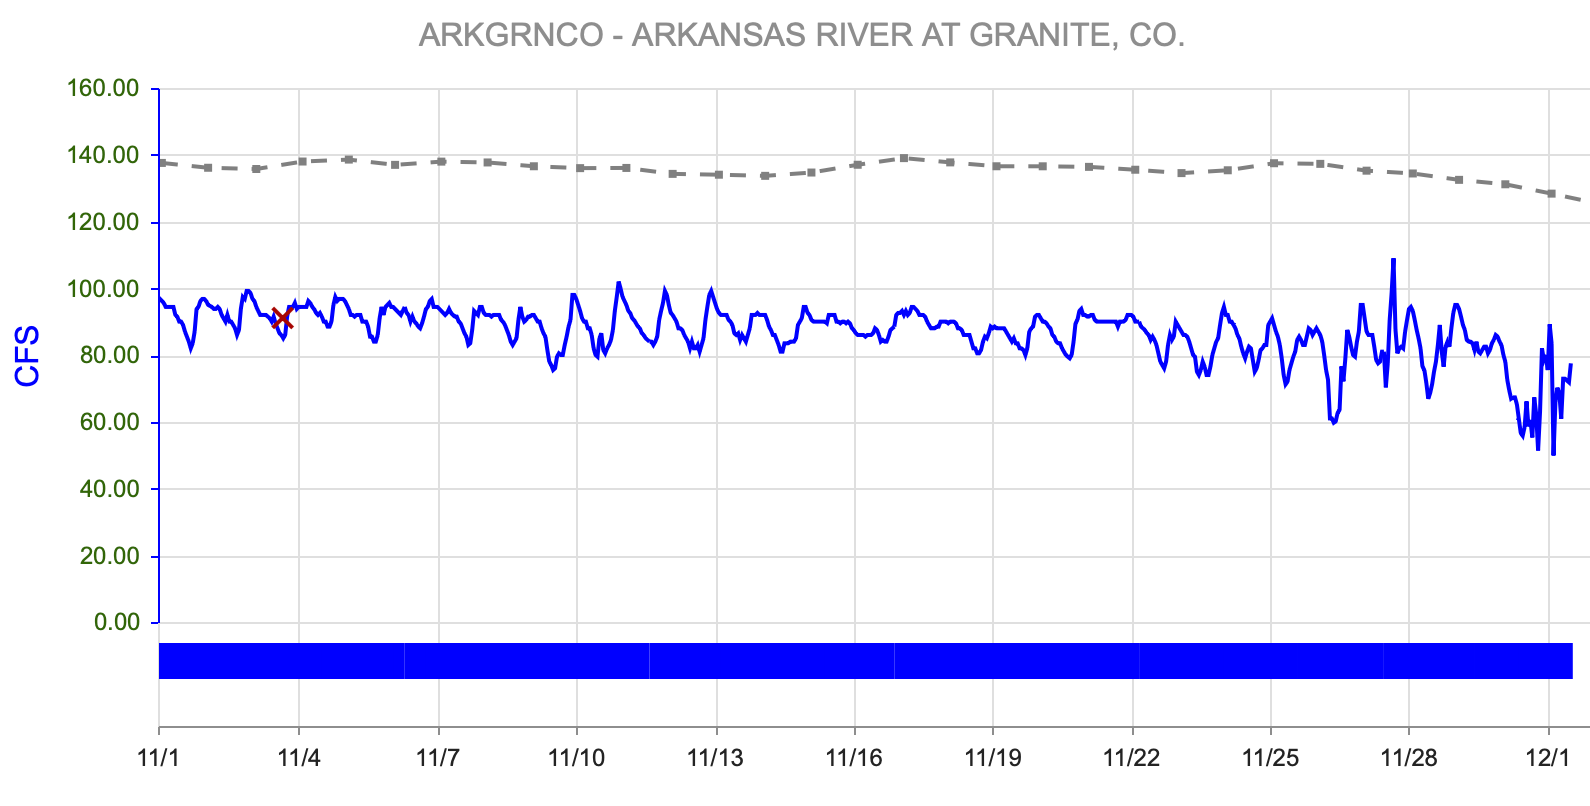
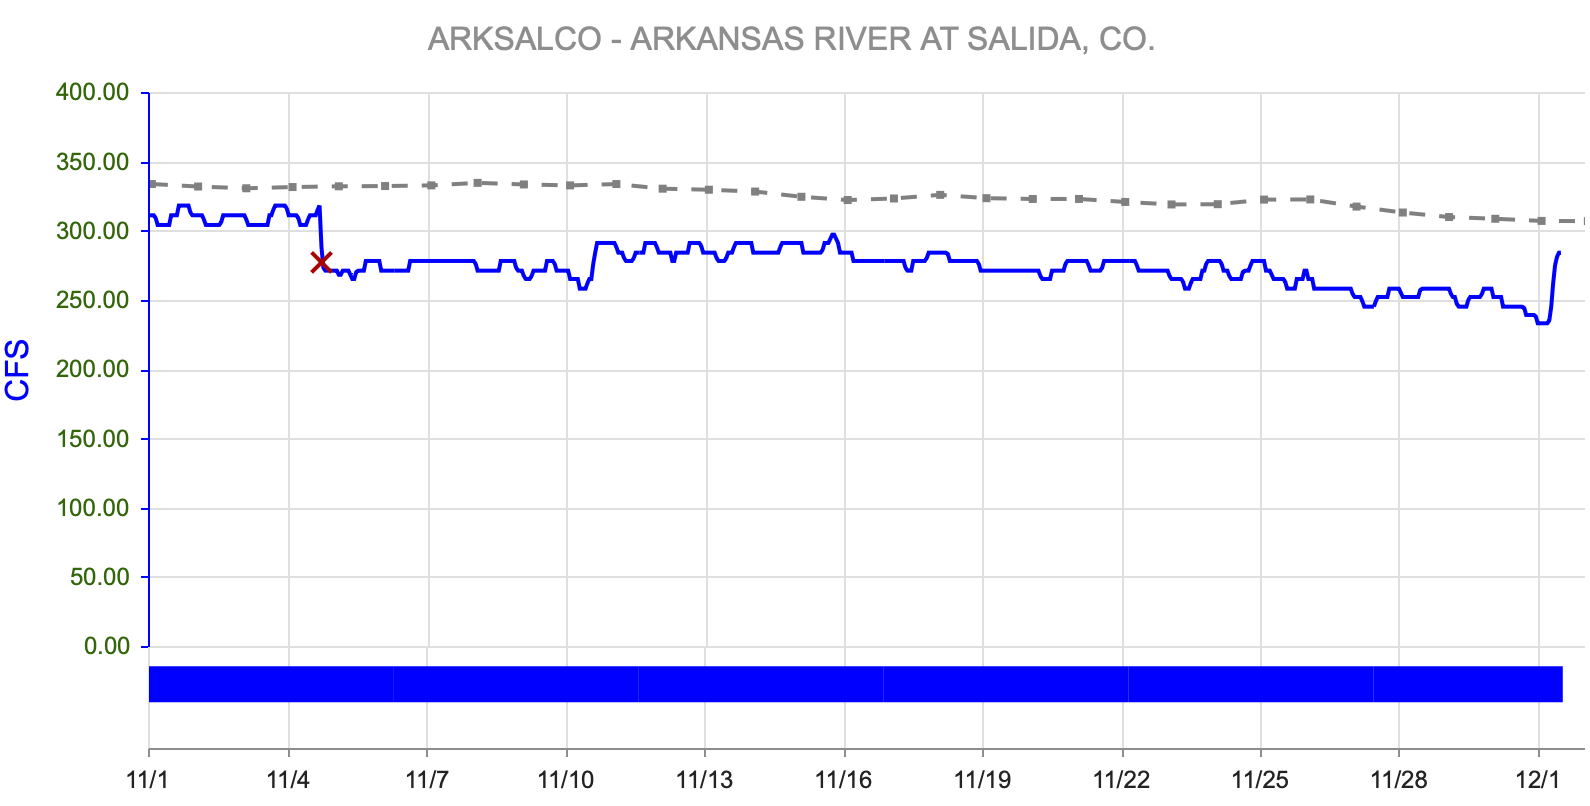
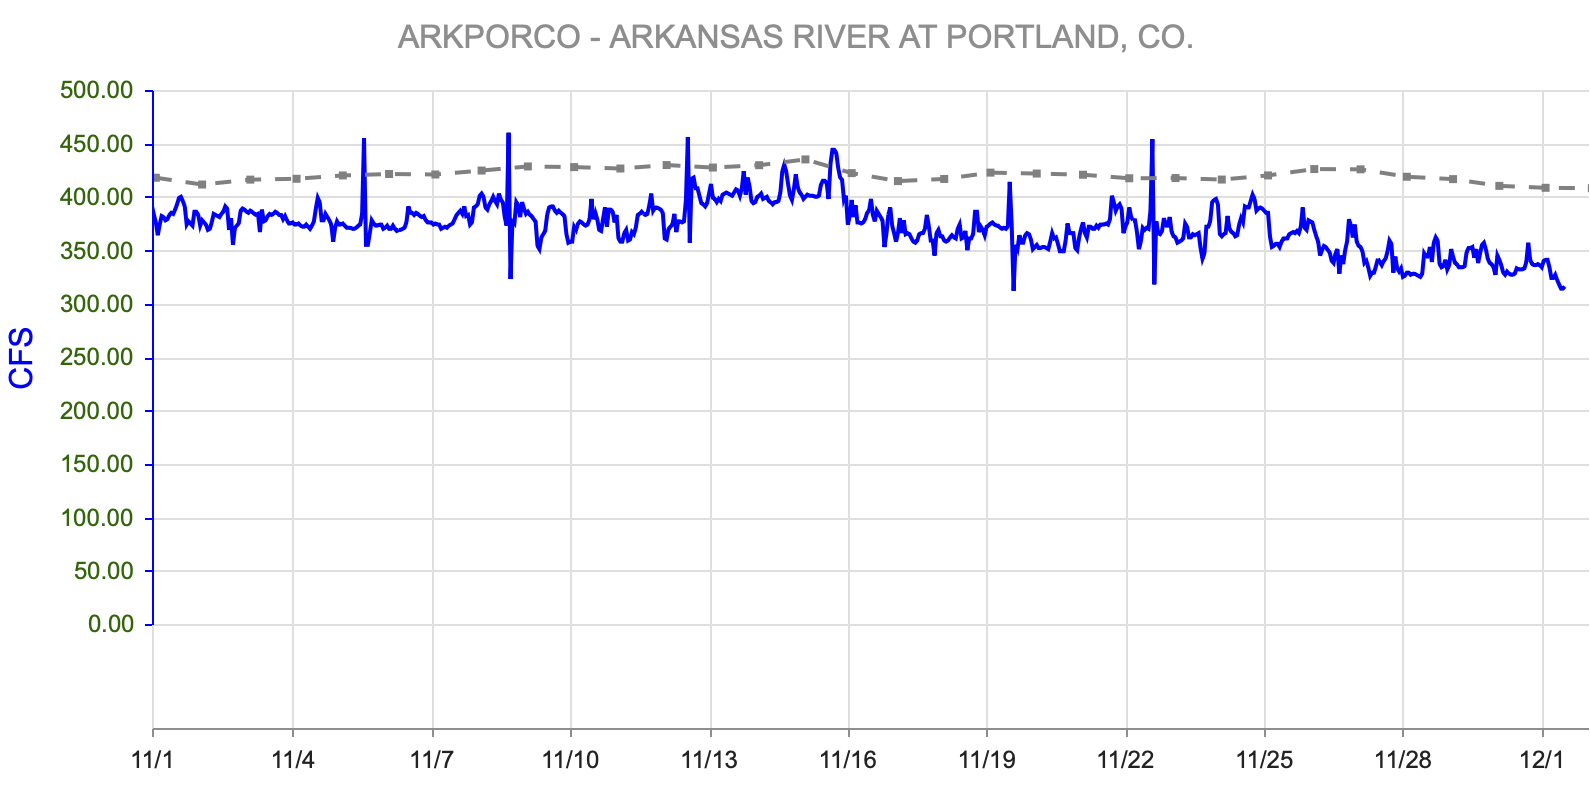
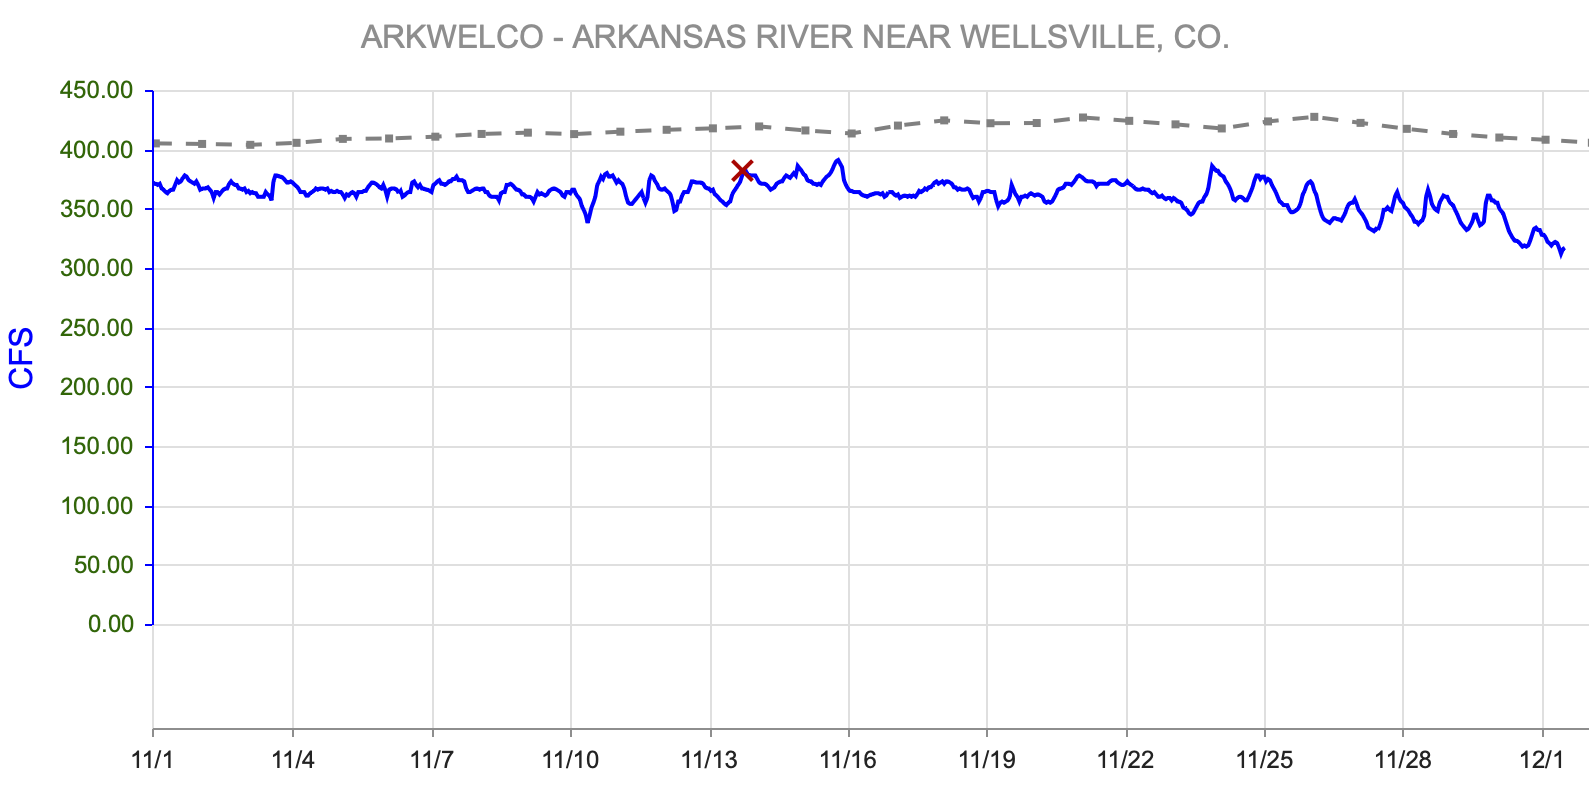
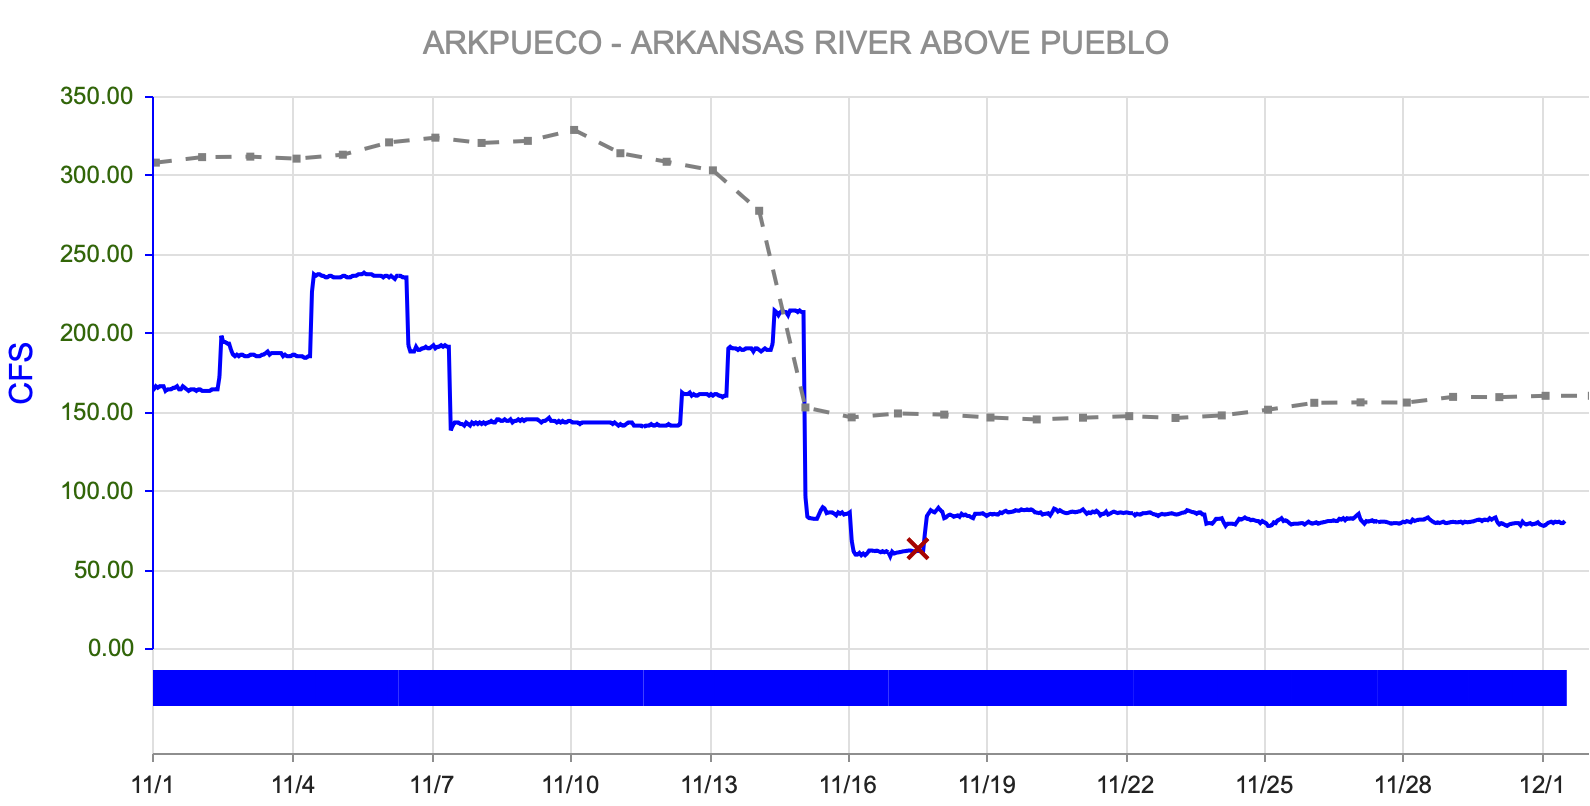
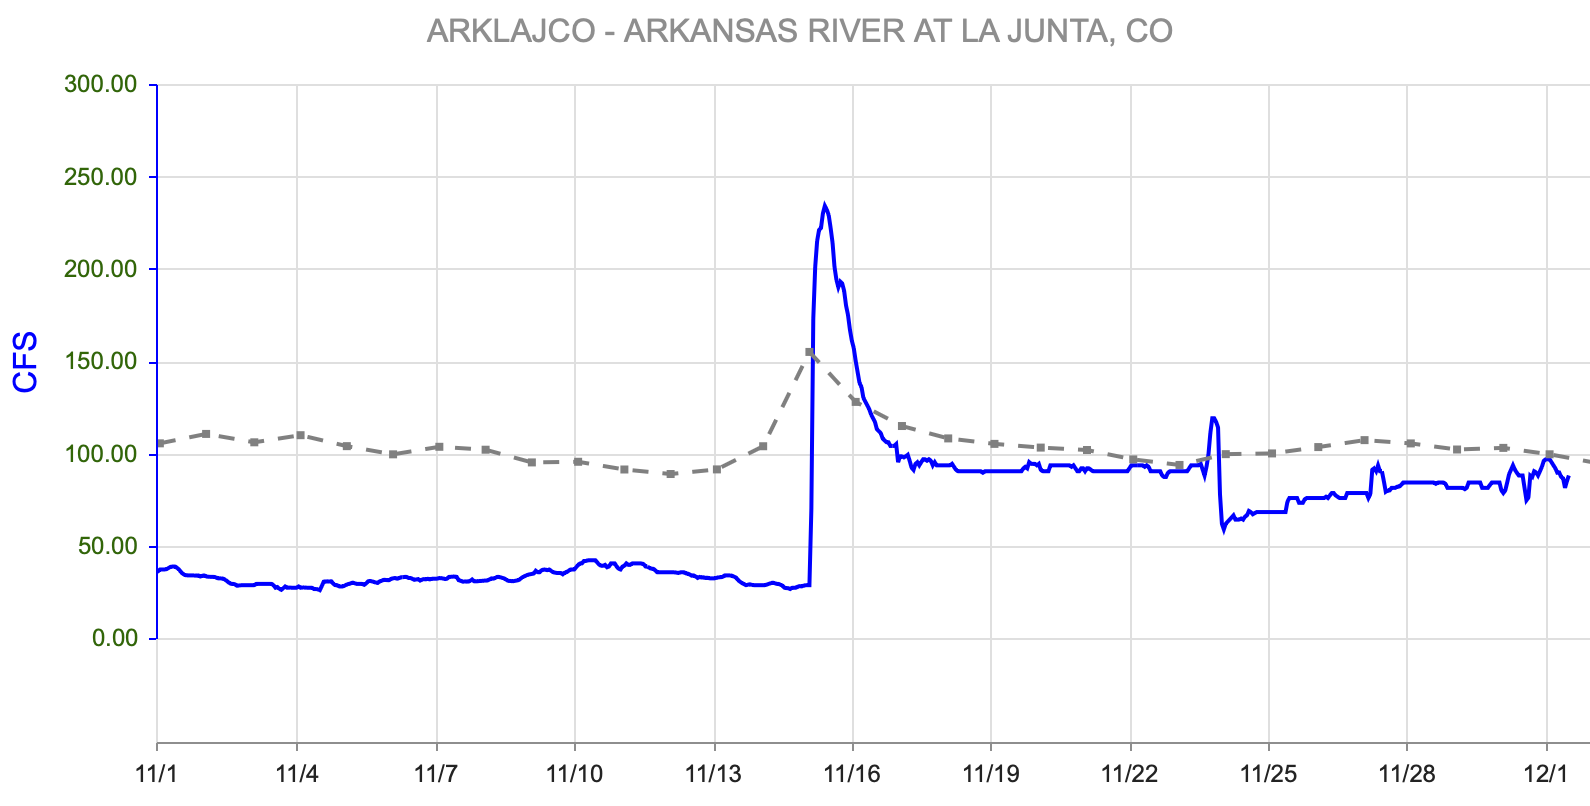
figure 12: Monthly Streamflow Discharge Compared to Historical Averge
Streamflow Snapshot (12/1/2025; 12:00 pm)
* measured flow totals include native flows, BOR project water, releases, and exchanges
Granite, CO (8 miles south of Leadville)- 67 cfs
Salida, CO- 244 cfs
Wellsville, CO- 329 cfs
Portland, CO (10 miles south of Canon City)- 335 cfs
Pueblo, CO- 28.6 cfs
Avondale, CO- 373 cfs
Lamar, CO- 20.3 cfs
For current streamflow updates, reference the Colors of Water webpage.
Reservoir Storage

figure 13: Reservoir Storage Percent of Median
Fall/Winter Outlook
According to the Colorado Climate Center, once forecasts extend beyond a couple of weeks, climatologists rely on statistical links between atmospheric behavior and slower moving climate systems such as El Niño and La Niña. Cooler than average ocean temperatures across the eastern and central Pacific are influencing tropical winds and shaping the Northern Hemisphere jet stream, which in turn guides the high and low pressure systems that bring or withhold storm activity in Colorado. Historically, El Niño tends to support wetter conditions across most of the state, while La Niña often benefits the northern and central Rockies during winter. Current projections show that this La Niña may weaken by spring, a timing that could allow Colorado to take advantage of its winter storm benefits without carrying La Niña impacts into the spring season.
OpenSnow reports a similar picture. La Niña is emerging this fall with the typical cooler sea surface temperature pattern in the eastern equatorial Pacific. Forecasts from the International Research Institute for Climate and Society show a likely return to neutral conditions between January and March, with many models hinting at a shift toward El Niño by late spring or summer of 2026 (figure 16). For the 2025 to 2026 winter, OpenSnow expects a weak and short lived La Niña Weak La Niñas have a tendency to support more frequent trough patterns over the Northwest and West Central United States and they also raise the likelihood of colder than normal temperatures across regions east of the Continental Divide (figure 17).

figure 14: Three Month Temperature Outlook

figure 15: Three Month Precipitation Outlook

figure 16: ENSO predictions

figure 17: Correlation Between ENSO ONI and Seasonal Precipitation in Colorado
Want to Learn More? Check out these resources below!
Monitoring
Drought Monitoring: US Drought Monitor
Drought Forecast: National Weather Service Climate Prediction Center
Precipitation Totals: Community Collaborative Ran, Snow, and Hail Network’s Precipitation Mapping System.
Snowpack: Natural Resources Conservation Service
Winter Water Storage System (only applicable until march): Southeastern Colorado Water Conservancy District
Precipitation: https://www.cocorahs.org/
Arkansas River Daily Report – http://www.div2waterops.com/dailyreports
Arkansas Streamflow: http://www.div2waterops.com/ColorsOfWater
Snow Survey and Water Supply Forecasting: Natural Resource Conservation Service Snow Survey
Additional monitoring resources:
Colorado Water Conservation District/Department of Natural Resources
Definitions
30 Year Running Average: When we present the monthly flows, we compare them to that month’s median flows from the last 30 years (referred to as 30 year running average).
Reservoir Percent Full: The Bureau of Reclamation considers a reservoir “full” when pool elevation is at the top of the active conservation pool. Percentage is therefore based on total reservoir volume below that level.
Educational Resources
Administrative Call Explained: DWR
Citizen’s Guide to Colorado Water Law: CFWE Education
Non-Attorney’s Guidebook to Colorado Water Courts: Co State
Voluntary Flow Management
- https://arkvalleyvoice.com/ahra-says-arkansas-river-flows-are-high-and-fast-making-safety-paramount/
- https://coloradotu.org/arkansas-river
U.S. Climate Normals: https://www.ncei.noaa.gov/products/land-based-station/us-climate-normals
