
Drought & Precipitation
The seasons are certainly changing, with snowfall and leaves changing in the higher elevation portions of the basin. Historically, September is one of the wettest months of the year, and this year has followed that trend. Conditions improved significantly across Colorado in September compared to August (figure 1; figure 2). Month-to-date precipitation in September reached 140% of the median, boosting soil moisture.

figure 1: Colorado Drought Monitor

figure 2: End of Sept vs. end of August drought monitor
Western Colorado has shifted from acute drought toward its more typical chronic, long-term deficits. Eastern Colorado has seen soil moisture rebound to near or above average (figure 3). Shallow soils have recovered more quickly than deeper reserves, but overall moisture conditions are healthier than earlier this summer.

figure 3: Soil moisure graphs

figure 4: PRISM proportion of annual average precipitation
In the Arkansas Basin, Water-Year-to-Date precipitation reached 96% of the median—the strongest recovery in the state—while statewide totals sit at 86% of the median.

figure 5: Month-to-Date Precipitation

figure 6: Month-to-Date Precipitation
September Precipitation Totals
Leadville-1.27 in
Buena Vista-1.51 in
Salida-1.21 in
Cañon City-0.41 in
Pueblo -0.66 in
Rocky Ford-1.13 in
Lamar-2.10 in
Temperature Trends
September brought cooler nights and more temperate days as we moved into fall in the mountains. Still, September temperatures were above average acorss the state for this time of year, with daily highs ranging from mid-60s to upper 80s (figure 7; figure 8). Following a cold front in the first full week, a warmer-than-average pattern took hold for the rest of the month. A ridge of high pressure was responsible for particularly warm and dry conditions in the second half of September.

figure 7: Departure from Normal Temperature

figure 8: Highest One-Day Temperature
Fire
Colorado experienced its most active wildfire season since 2020 (figure 9). By late August, more than 200,000 acres had burned across the state, driven by persistent drought, critically dry fuels, and prolonged summer heat. According to the U.S. Drought Monitor, nearly all of the Western Slope was in “severe” to “extreme” drought at that time, with vegetation stressed to the point of fueling rapid fire spread, torching, and resistance to control.
September rains have provided some relief but have also brought new risks. High-intensity storms have triggered flash flooding in burn scars, improving short-term soil moisture but producing runoff. Flash flood events make it difficult for water to be captured for storage purposes, so water storage totals for municipalities have not been reflective of the increase in precipitation throughout September.

figure 9: Acres Burned Across Colorado
The National Interagency Fire Center’s September Significant Wildfire Potential Outlook is showing Colorado is “out of the red zone”, but that doesn’t mean that we should let our guard down (figure 10). Wildfires can ignite year round and most wildfires in Colorado are human caused. Please make sure to maintain good fire safety habits throughout the fall and winter.

figure 10: Significant Wildfire Potential Outlook
Streamflow
Streamflow across the Arkansas Basin ran average to slightly below average in September, with an adjusted monthly volume of 84% of average(figure 11; figure 12). Discharge levels at the Salida River gauge on the Arkansas River were in the 24th percentile of long term average (1910-2025) for the 2025 water year (figure 13).

figure 11: Map of 28-day average streamflow compared to historical median

figure 12: Monthly Observed Streamflow

figure 13: Water Year Discharge at the Arkansas River Salida Gauge
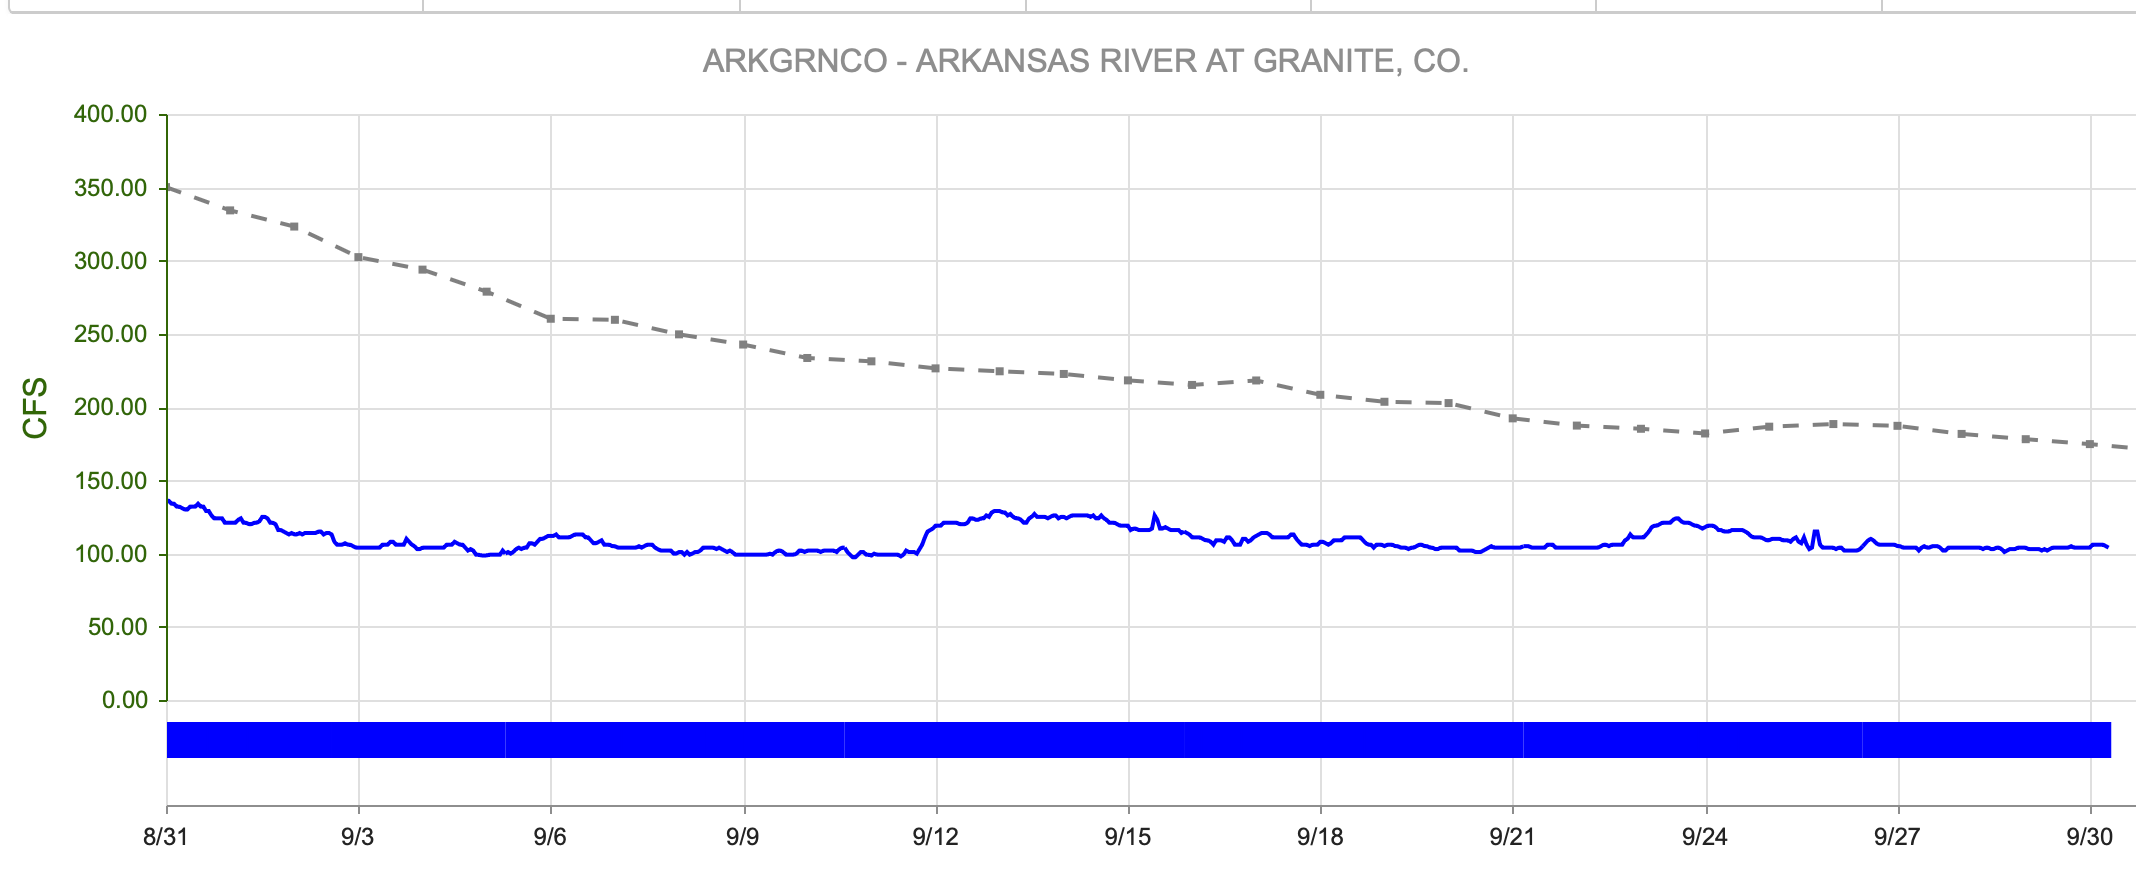
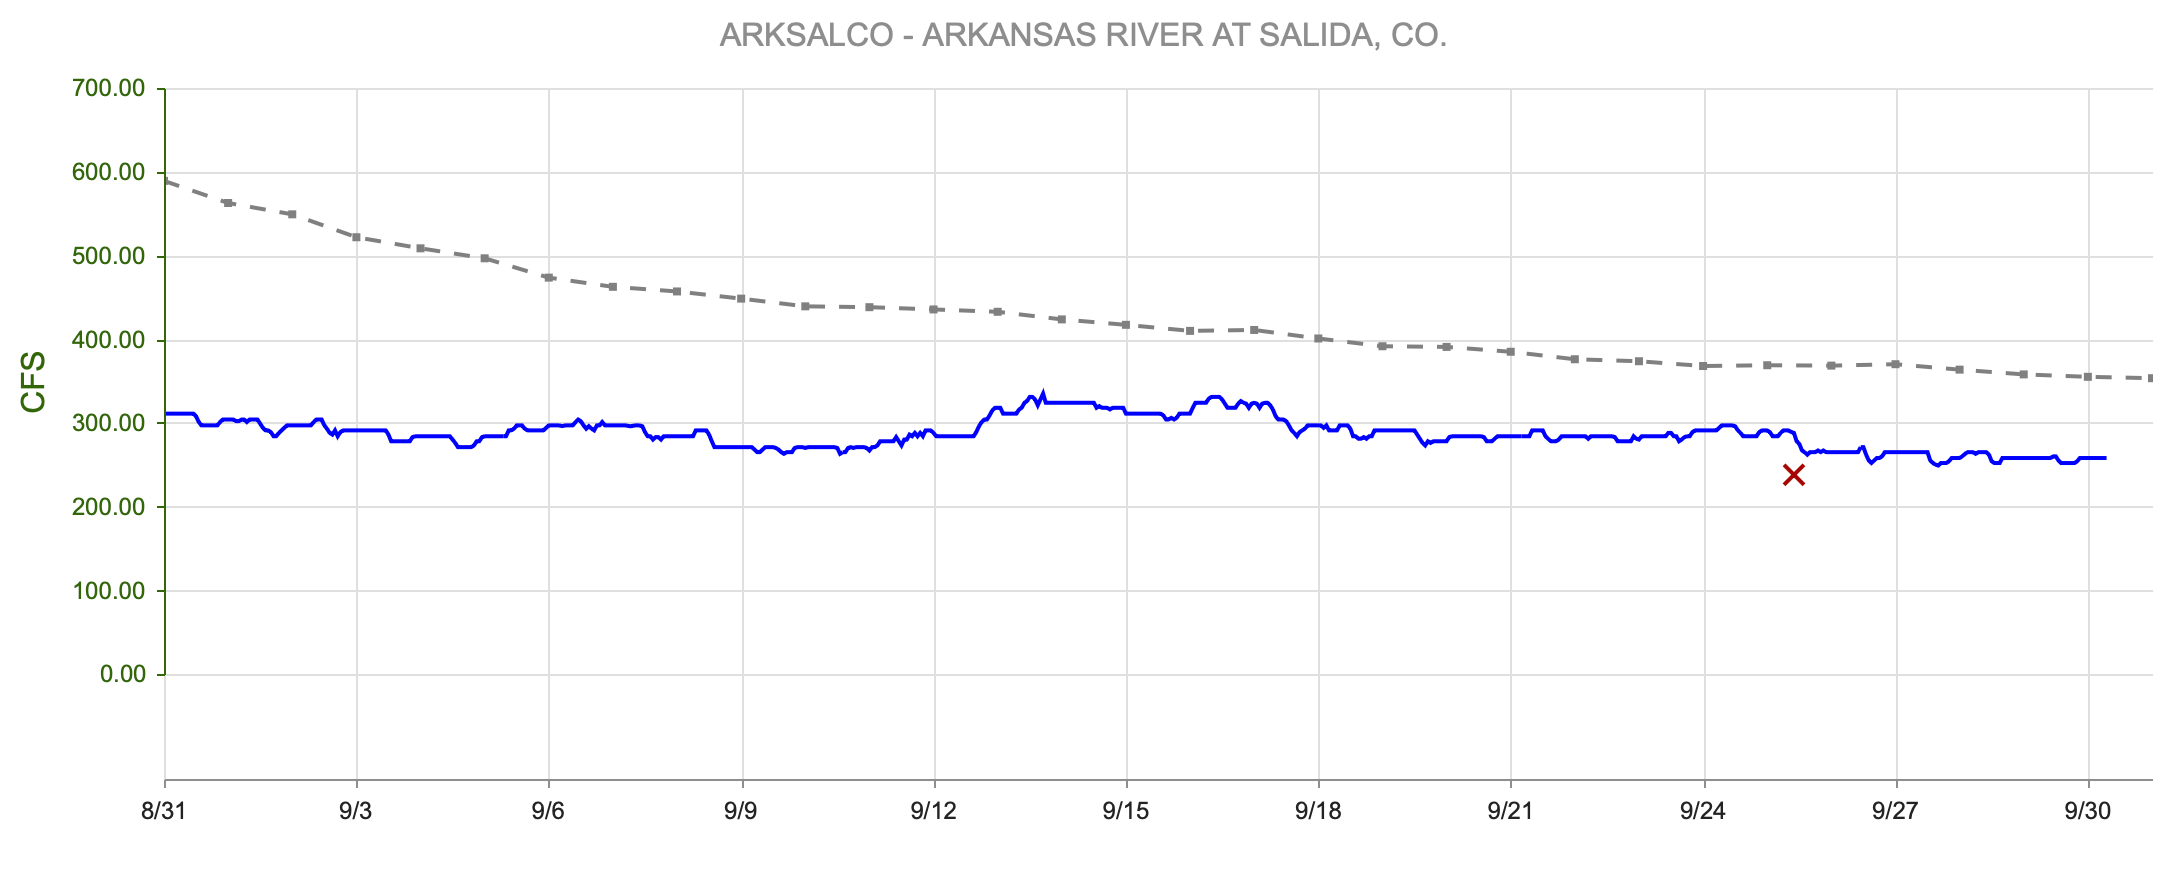
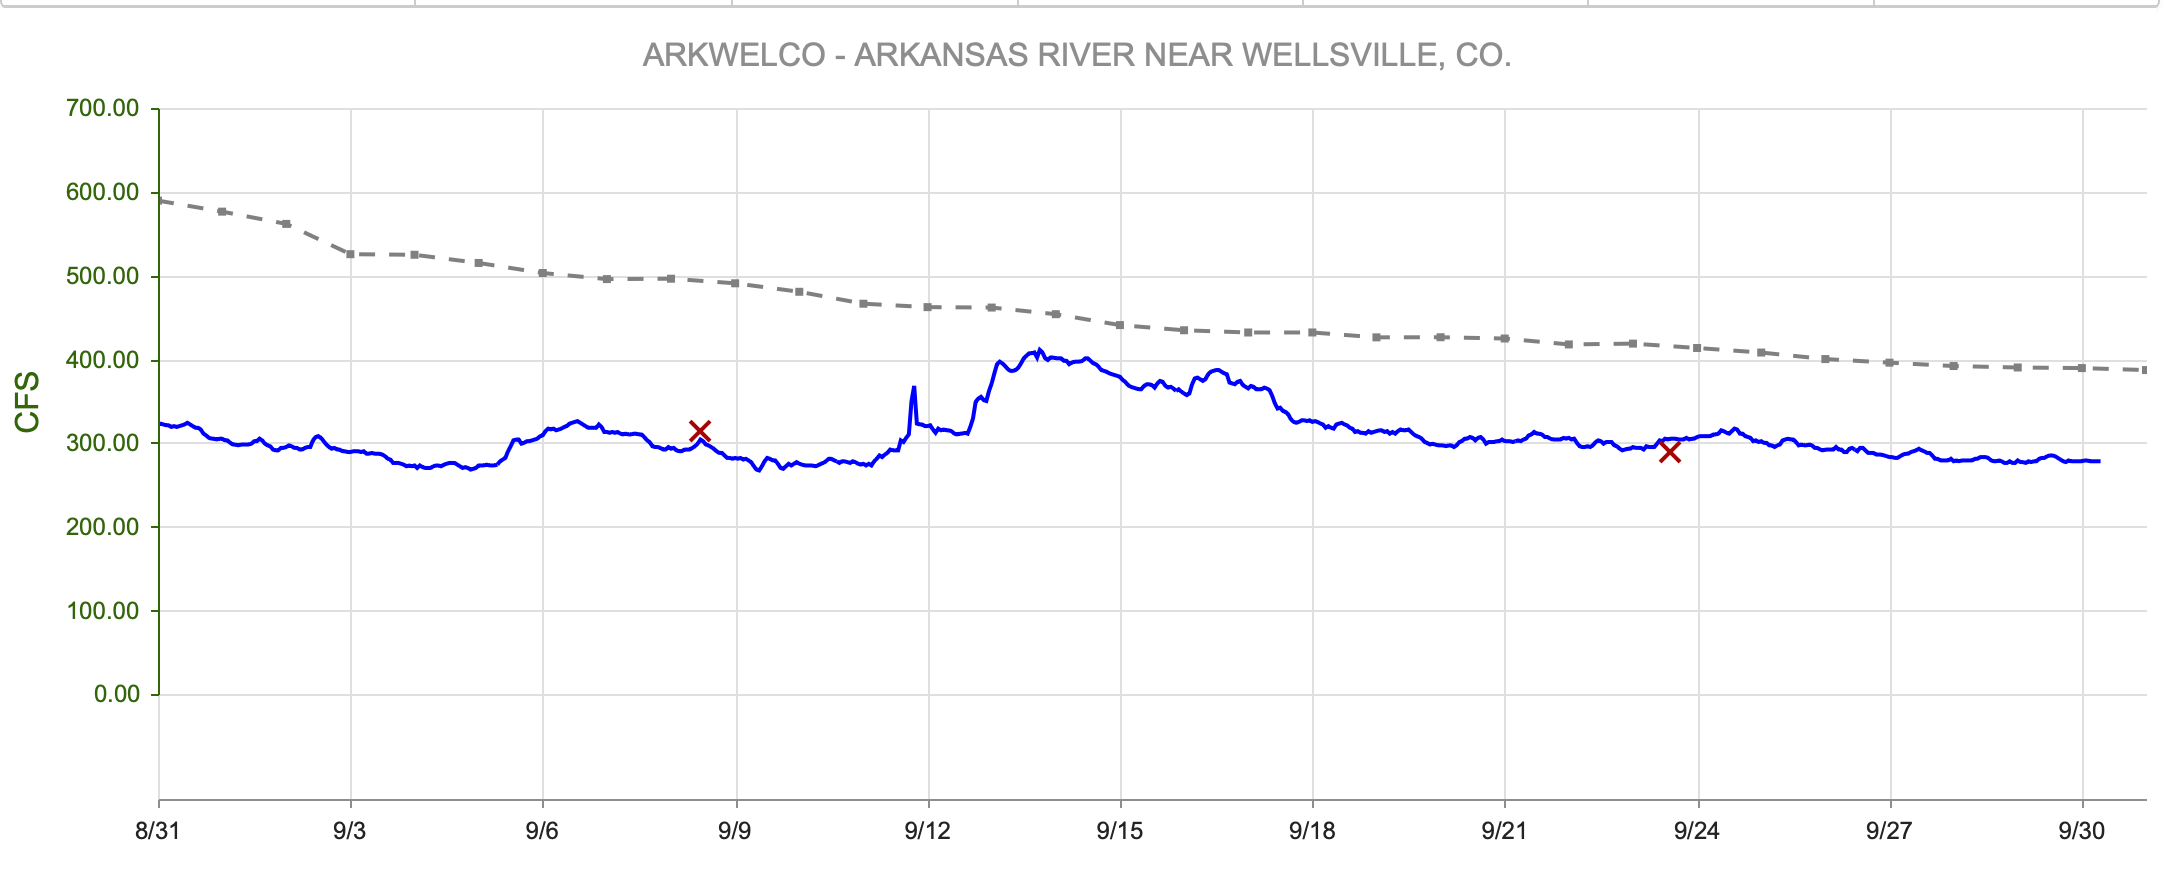
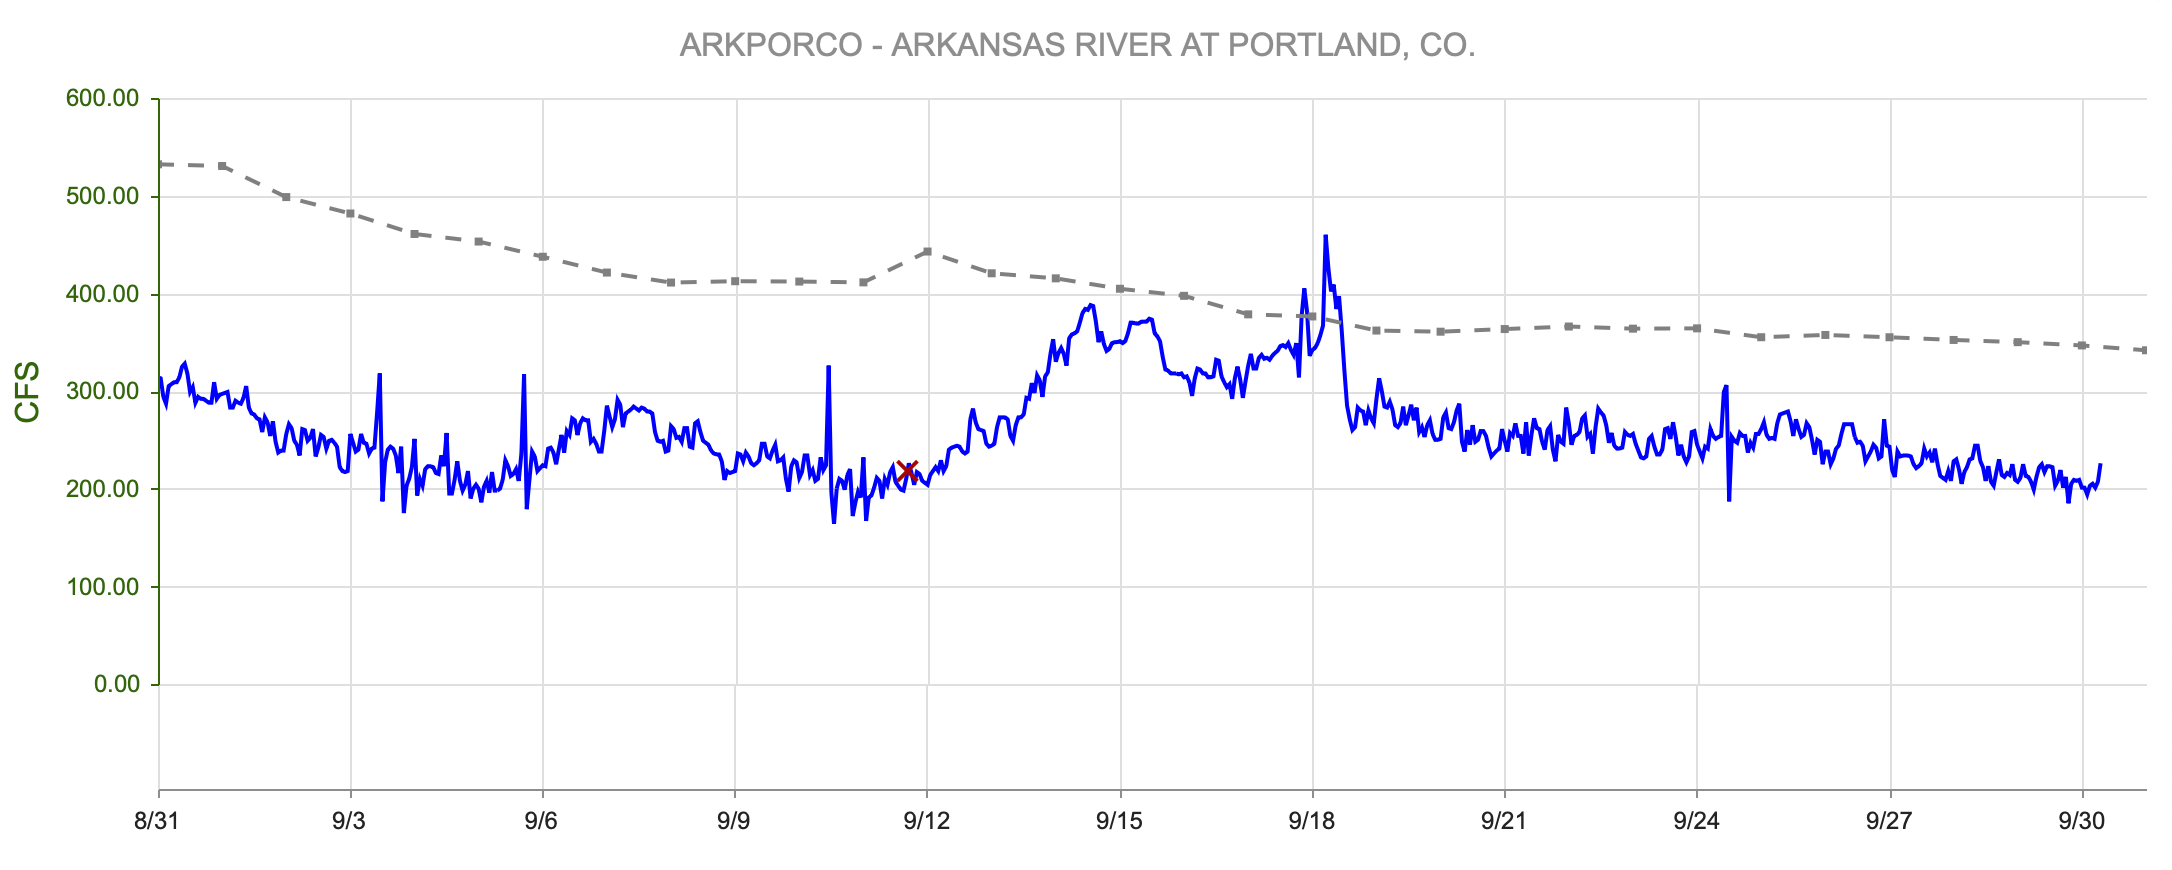
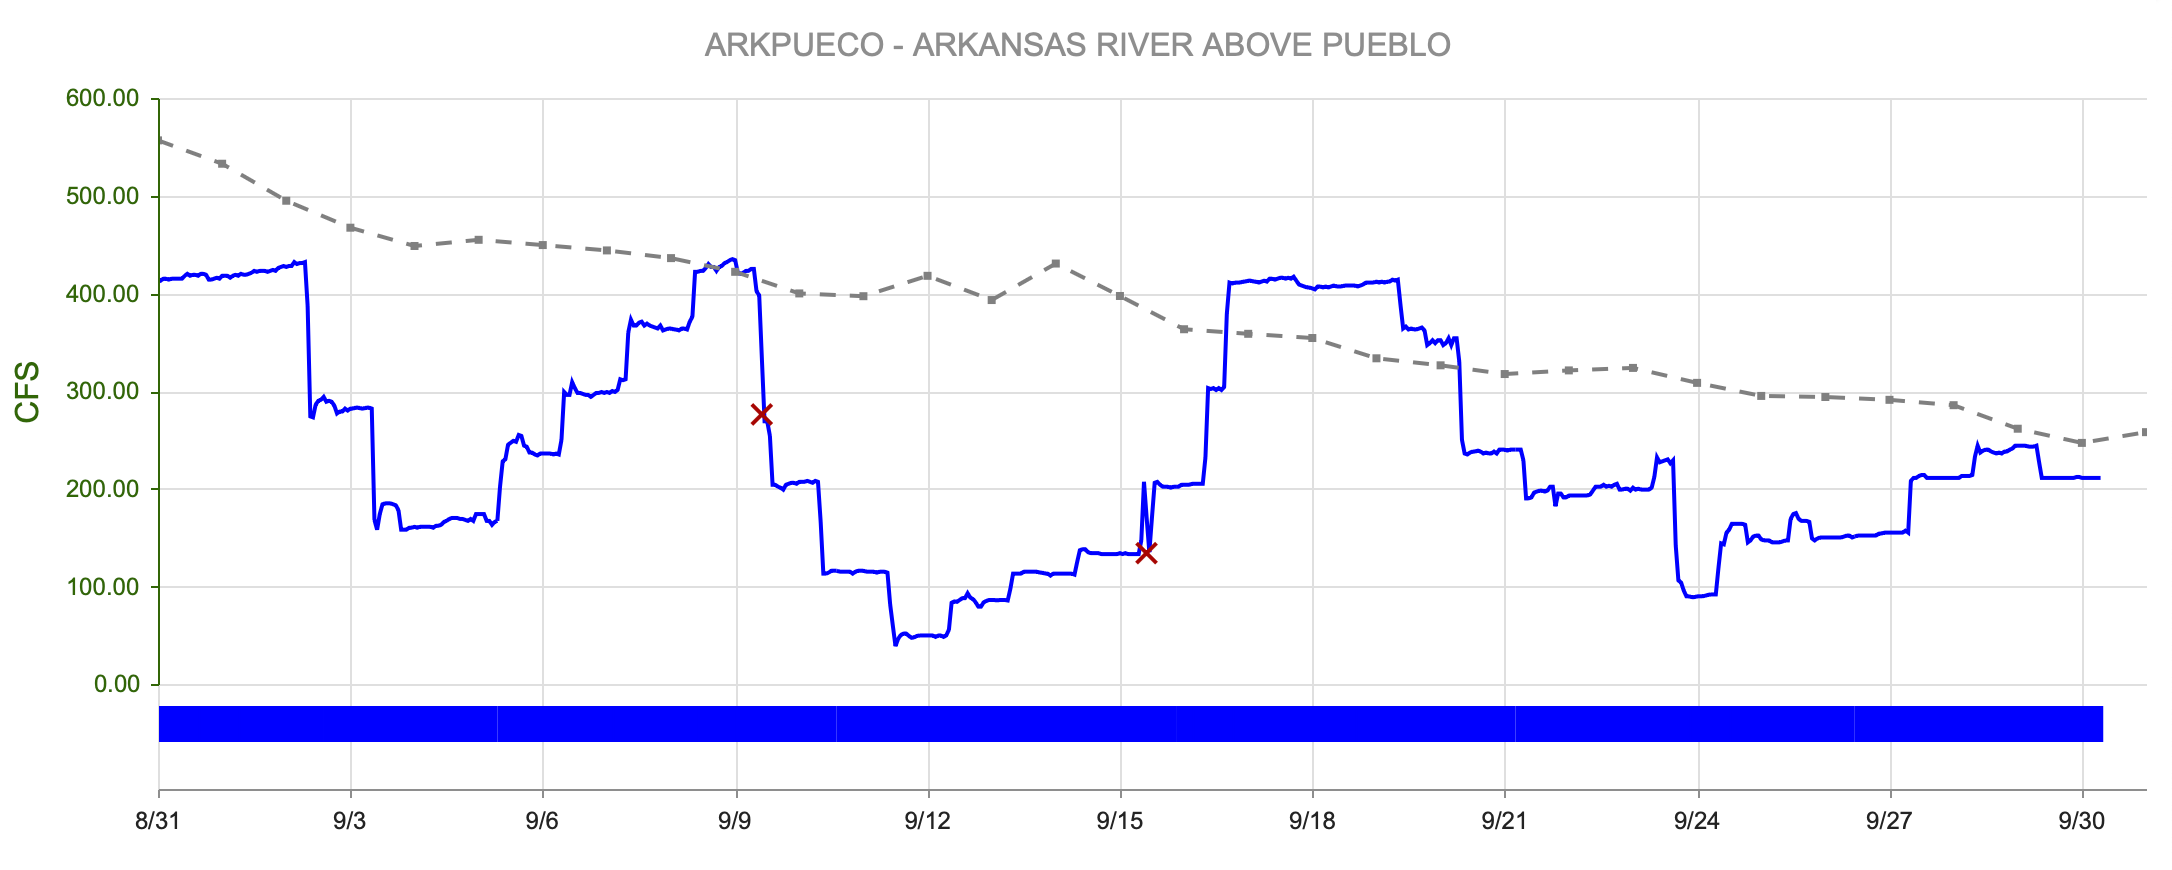
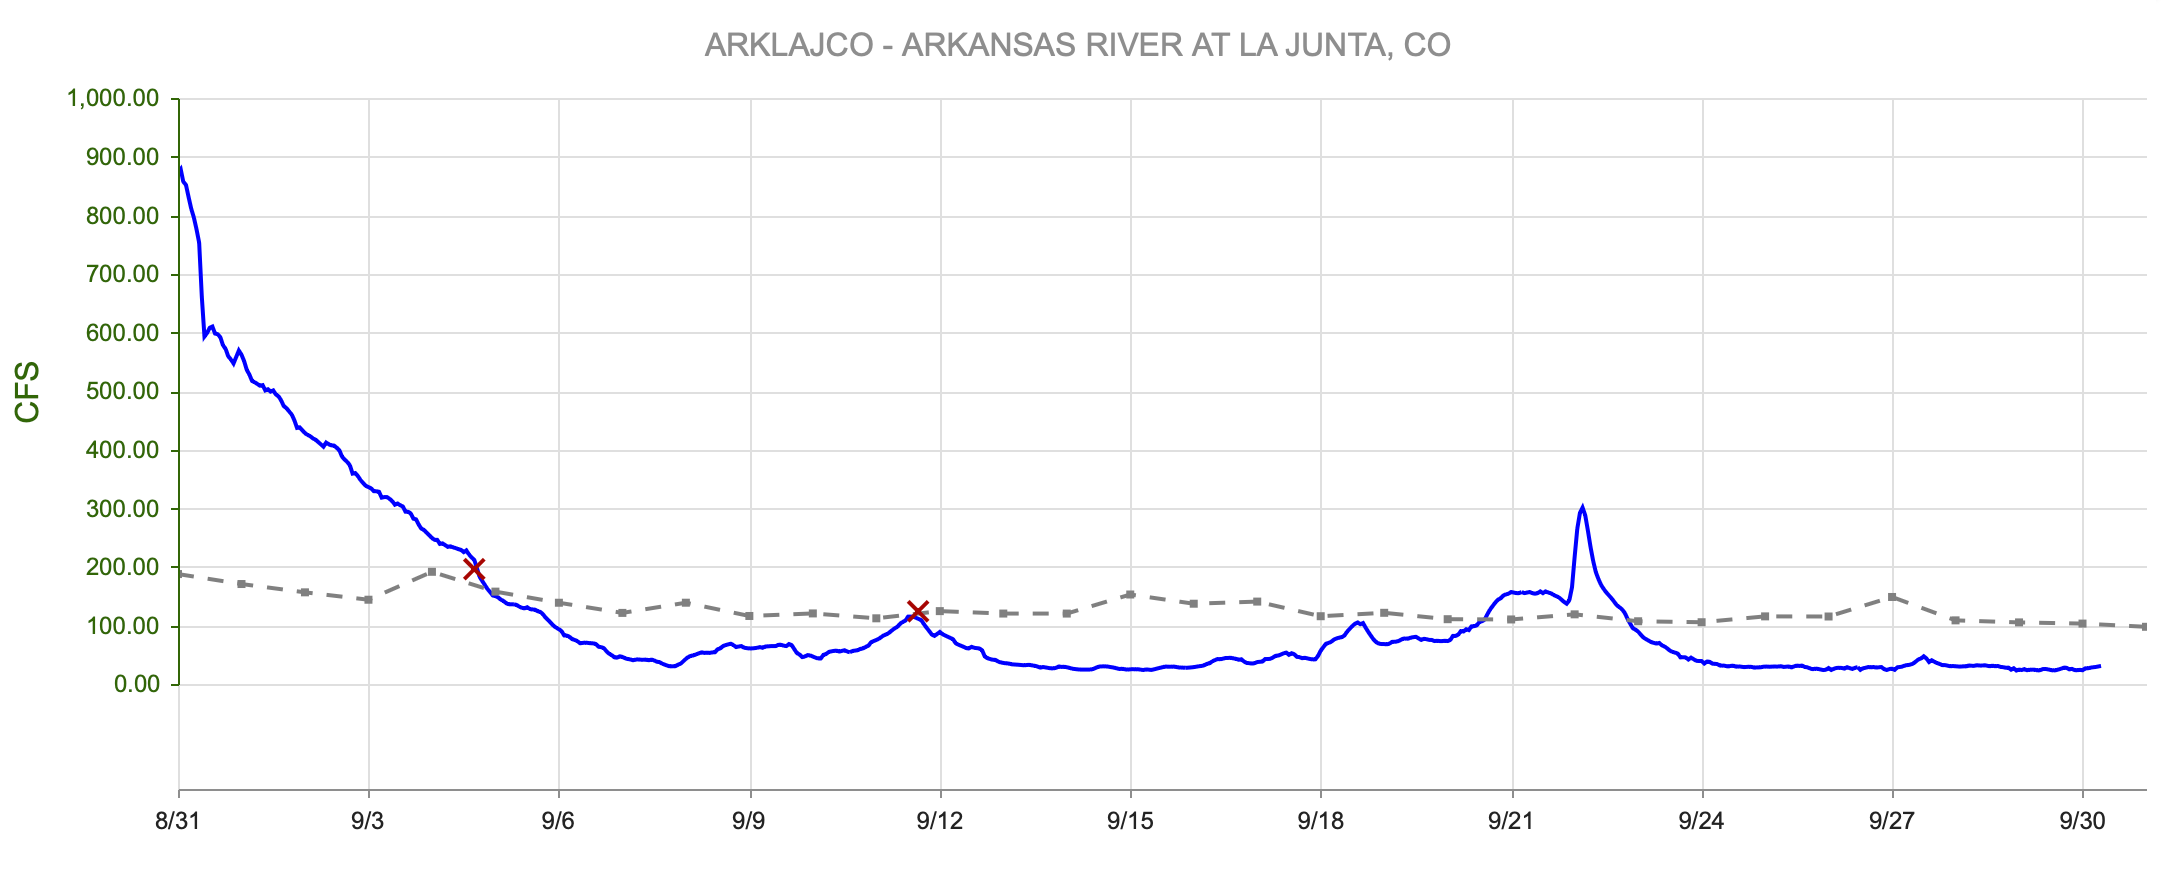
figure 12: Monthly Streamflow Discharge Compared to Historical Averge
Streamflow Snapshot (10/1/2025; 12:00 pm)
* measured flow totals include native flows, BOR project water, releases, and exchanges
Granite, CO (8 miles south of Leadville)- 104 cfs
Salida, CO- 297 cfs
Wellsville, CO- 280 cfs
Portland, CO (10 miles south of Canon City)- 209 cfs
Above Pueblo Reservoir, CO- 213 cfs
Avondale, CO- 333 cfs
Lamar, CO- 29.7 cfs
For current streamflow updates, reference the Colors of Water webpage.
Reservoir Storage

figure 14: Reservoir Storage Percent of Median
Fall/Winter Outlook
Looking ahead to the fall and winter, models continue to show elevated chances for above-normal temperatures and below-normal precipitation across much of Colorado (figure 15; figure 16). Climate drivers add uncertainty to the coming season. Forecasts point to a likely transition from ENSO-neutral to La Niña in the coming months.
“A transition from ENSO-neutral to La Niña is likely in the next couple of months, with a 71% chance of La Niña during October – December 2025. Thereafter, La Niña is favored but chances decrease to 54% in December 2025 – February 2026,” wrote the NOAA Climate Prediction Center in September (figure 17).
As a reminder, La Niña often brings drier conditions to Colorado, particularly in the southwest, while favoring winter snowfall in the northern mountains. However, the strength and duration of this year’s La Niña are uncertain, making the winter outlook less reliable than usual. For the fall, forecasters maintain high confidence in warmer and drier than average conditions for October through December.

figure 15: Three Month Temperature Outlook

figure 16: Three Month Precipitation Outlook

figure 17: ENSO predictions

figure 18: 2025-26 Snowfall Forecast
Want to Learn More? Check out these resources below!
Monitoring
Drought Monitoring: US Drought Monitor
Drought Forecast: National Weather Service Climate Prediction Center
Precipitation Totals: Community Collaborative Ran, Snow, and Hail Network’s Precipitation Mapping System.
Snowpack: Natural Resources Conservation Service
Winter Water Storage System (only applicable until march): Southeastern Colorado Water Conservancy District
Precipitation: https://www.cocorahs.org/
Arkansas River Daily Report – http://www.div2waterops.com/dailyreports
Arkansas Streamflow: http://www.div2waterops.com/ColorsOfWater
Snow Survey and Water Supply Forecasting: Natural Resource Conservation Service Snow Survey
Additional monitoring resources:
Colorado Water Conservation District/Department of Natural Resources
Definitions
30 Year Running Average: When we present the monthly flows, we compare them to that month’s median flows from the last 30 years (referred to as 30 year running average).
Reservoir Percent Full: The Bureau of Reclamation considers a reservoir “full” when pool elevation is at the top of the active conservation pool. Percentage is therefore based on total reservoir volume below that level.
Educational Resources
Administrative Call Explained: DWR
Citizen’s Guide to Colorado Water Law: CFWE Education
Non-Attorney’s Guidebook to Colorado Water Courts: Co State
Voluntary Flow Management
- https://arkvalleyvoice.com/ahra-says-arkansas-river-flows-are-high-and-fast-making-safety-paramount/
- https://coloradotu.org/arkansas-river
U.S. Climate Normals: https://www.ncei.noaa.gov/products/land-based-station/us-climate-normals
