
If you are in Colorado right now, you don’t need SNOTEL data to understand our current climatic conditions. A glance at the bare mountains tells the story: January has been historically warm and dry. A late-January snowfall brought some relief to parts of the Arkansas River Basin, but statewide snowpack remains the lowest in the 30-year period of record. With winter 51% complete, Colorado would need roughly 145% of normal snow accumulation for the remainder of the season to return to average snowpack levels.
Drought & Precipitation
Colorado entered January under persistent warm and dry conditions that continued to erode early winter moisture gains. December precipitation ranked poorly across much of the state, with December 2025 marking the 34th driest December on record across the West Slope, Southwest Colorado, and Northwest Colorado (figure 1). Virtually no precipitation was recorded in the far northwest corner of the state. Although December is climatologically the driest month in these regions, the lack of snowfall further compounded already weak early-season conditions.

figure 1: Precipitation Rank Oct-Dec 2025
January has provided only limited relief. While some mountain areas received modest snowfall, dry conditions persisted across northeast Colorado. Together, these patterns have contributed to expanding drought coverage statewide (figure 2).
According to the U.S. Drought Monitor, drought conditions have intensified across Colorado, with approximately 16 percent of the state now classified as severe drought or worse (figure 3). Exceptional drought re-emerged in December, affecting portions of Eagle, Pitkin, Park, Lake, and Summit Counties.

figure 2: Colorado Drought Monitor

Snowpack
“We have 4.8 inches of water content on average across all of our snow measuring sites in Colorado,” reported Brian Domonkos, Colorado snow survey supervisor for the U.S. Natural Resources Conservation Service, during the January Colorado Water Conservation Board Water Conditions Monitoring Committee meeting. “Typically, at this point in the year, we have about 8.5 inches of water content in the snowpack.”
Statewide snowpack conditions deteriorated sharply through January. Colorado’s Arkansas River snow water equivalent (SWE) is currently tracking at approximately 56% of the median, the lowest value observed for this point in the season in the 40-year period of record (figure 4). Colorado’s Arkansas River Basin is at 48% of the median SWE (figure 5). Several SNOTEL sites are reporting their lowest snowpack values on record. Notably, higher-elevation sites are not outperforming lower-elevation sites, which has negative implications for spring runoff (figure 6).


figure 5: Arkansas River Basin SWE

figure 6: Snowpack By Elevation
With winter now approximately 51% complete, a climatologically normal accumulation for the remainder of the season would result in an end-of-winter snowpack of roughly 74% of median. To return to near-normal conditions, Colorado would need approximately 145% of normal snow accumulation from this point forward; a scenario that would place significant strain on snow removal operations, avalanche mitigation efforts, and other state and local resources.

figure 7: Colorado Snow Water Equivalent Comparison
Percent-of-normal metrics can be misleading during extreme years such as this one. Rankings and comparisons to analog years provide a clearer context and show that snowpack deficits of this magnitude rarely recover (figure 8). Only a handful of years in the historical record have recovered from comparable midwinter snowpack deficits. Among those, 2000 stands out as a rare example of a season that began well below normal and rebounded to near-normal snowpack conditions by the end of winter.

figure 8: Water Year 2026 Snow Water Equivalent in Colorado Compared to Similar Years
January Precipitation Totals
Leadville-0.30″
Buena Vista-0.08″
Cañon City-0.24″
Pueblo -0.64″
La Junta-0.71″
Lamar-0.65″
A snowstorm and cold snap on January 23rd-January 25th brought significant snowfall to parts of the Arkansas River Basin (figure 9). Below are the snowfall totals for these dates (source: OpenSnow).
Monarch Pass: 14″
Colorado Springs: 5.1″
Leadville: 5″
Pueblo: 3″
Cañon City: 2″
La Junta: 2″

figure 9: Late Jan 2026 snow storm 72-hr snowfall
Soil Moisture
Soil moisture conditions vary by region but are trending downward overall. Southwestern Colorado retains some residual soil moisture following a wet fall, while northeast Colorado has also maintained moderate moisture levels, though shallow soils are beginning to show signs of drying out(figure 10).
Evaporative demand, as measured by the Evaporative Demand Drought Index (EDDI), has been exceptionally high statewide. Elevated evaporative demand has been driven by persistent warmth, low humidity, and frequent wind events, accelerating moisture loss from soils, vegetation, and snowpack (figure 11).

figure 10: 1-Meter Soil Moisture

figure 11: Evaportative Demand Drought Index
Temperature Trends
As Russ Schumacher, professor of atmospheric science at Colorado State University and the state climatologist, put it, Colorado is experiencing a “disturbingly warm” winter. December 2025 was the warmest December on record statewide, with record warmth observed across nearly all regions (figure 12; 13; 14). The San Juan Mountains were the lone exception, narrowly missing record values. More than 1,000 daily maximum and minimum temperature records were broken across Colorado during the month, and parts of central and northwest Colorado averaged more than 10°F above normal. Overall, 2025 ranked as the fourth-warmest year on record.

figure 12: Oct-Dec 2025 Average Temp Ranking

figure 13: Record Daily High Max Temps for 2025-12-12

figure 14: Dec 2025 Statewide Average Temperature Ranks
January has followed closely behind, with above-average temperatures observed across the entire Western Slope throughout the month (figure 15). The month ended with a brief cold snap that temporarily brought more winterlike conditions to the Arkansas River Basin (figure 16).

figure 15: Daily Average Temperature in the Arkansas-White-Red River Basin

figure 16: Departure from Normal Temperatures
Streamflow

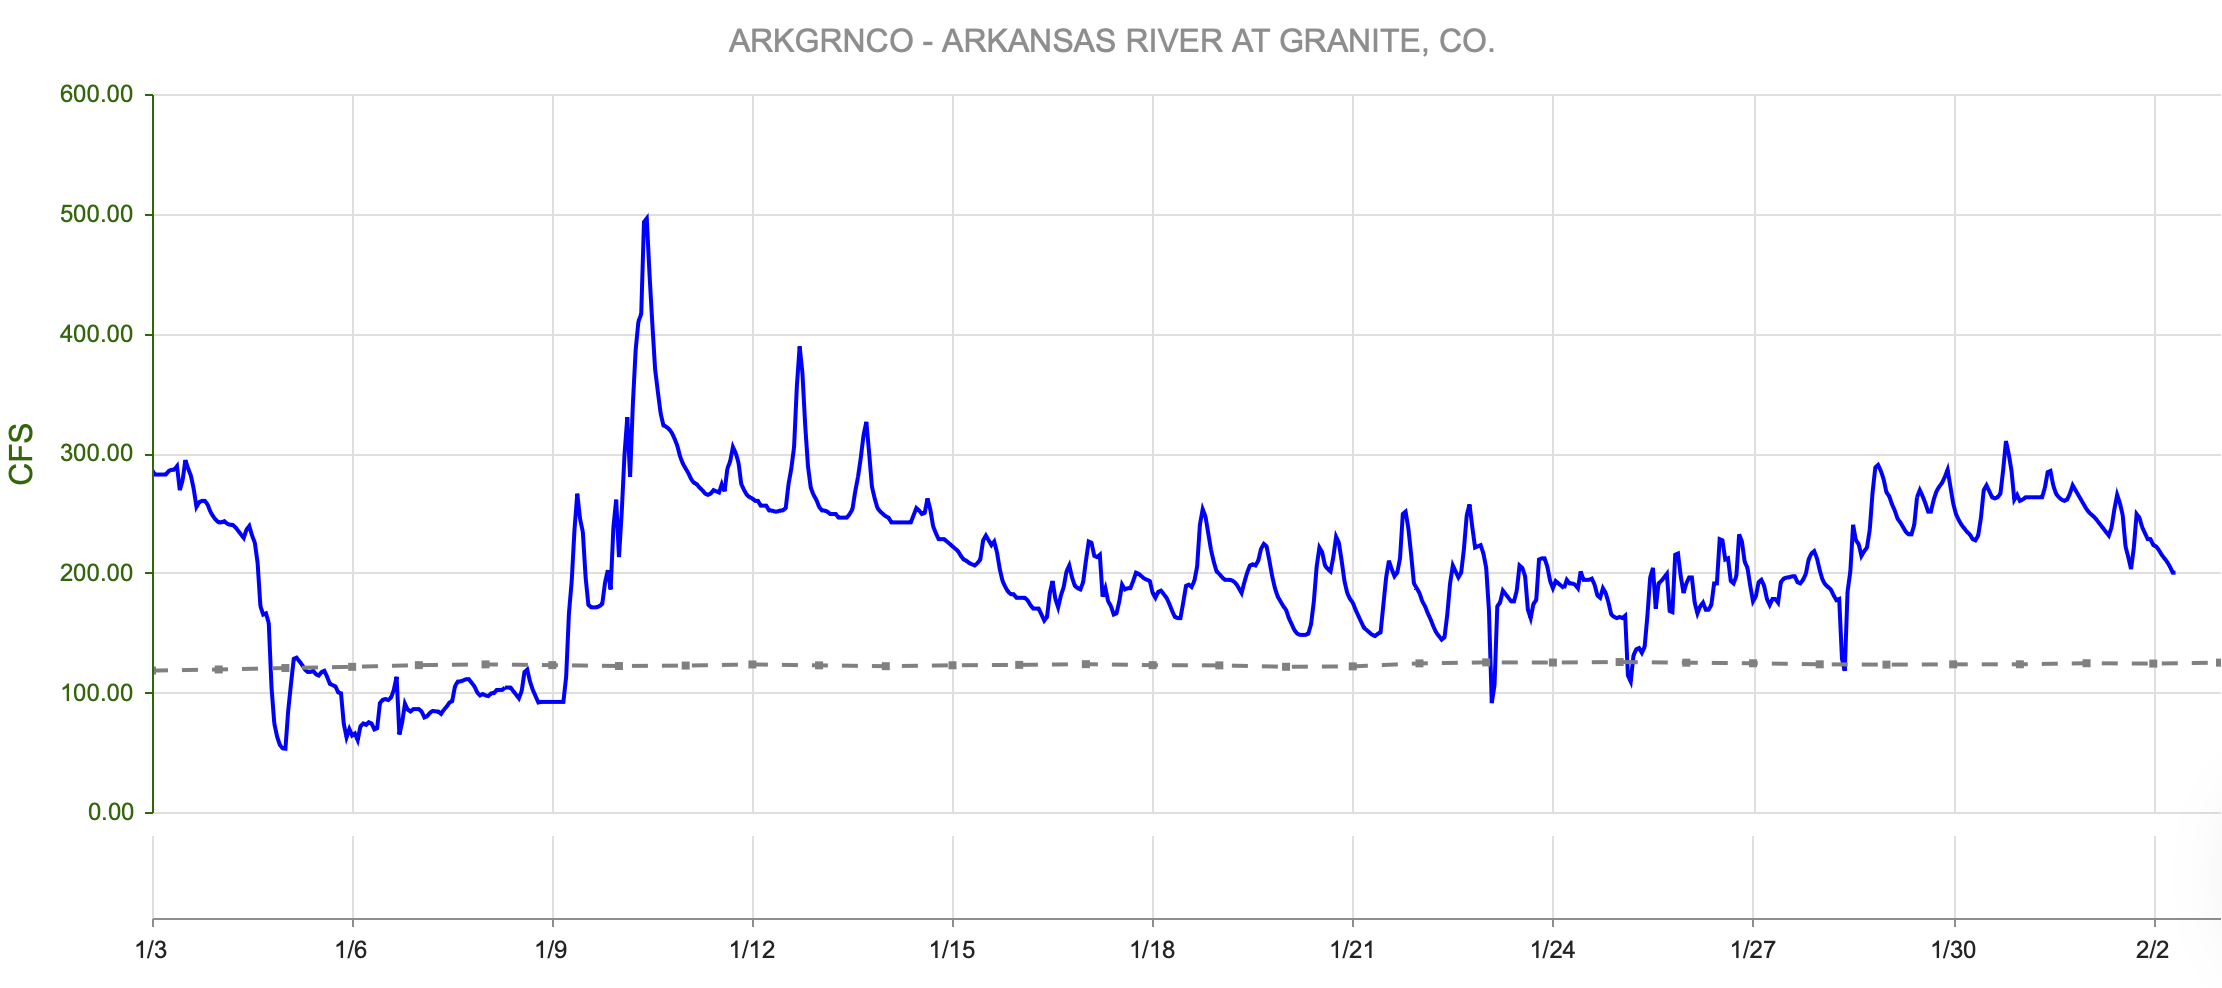
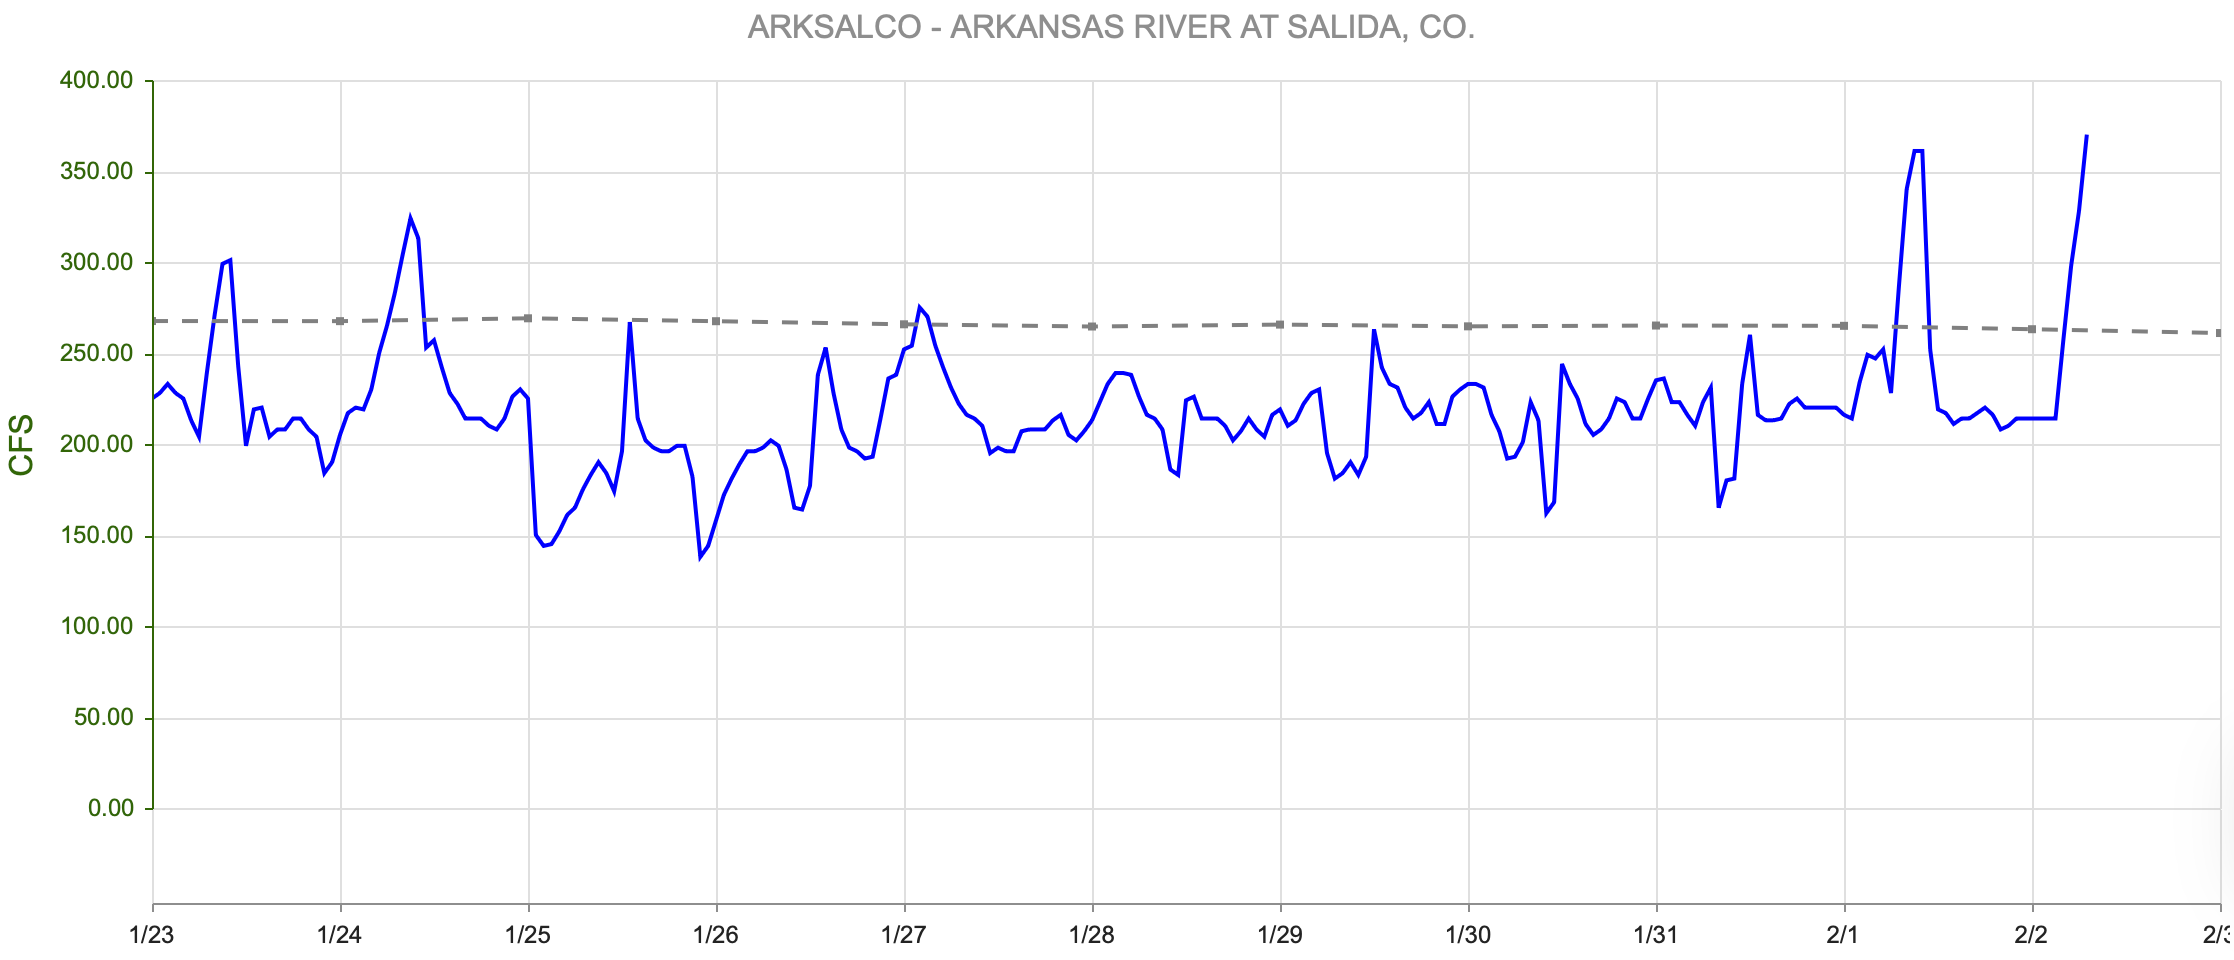
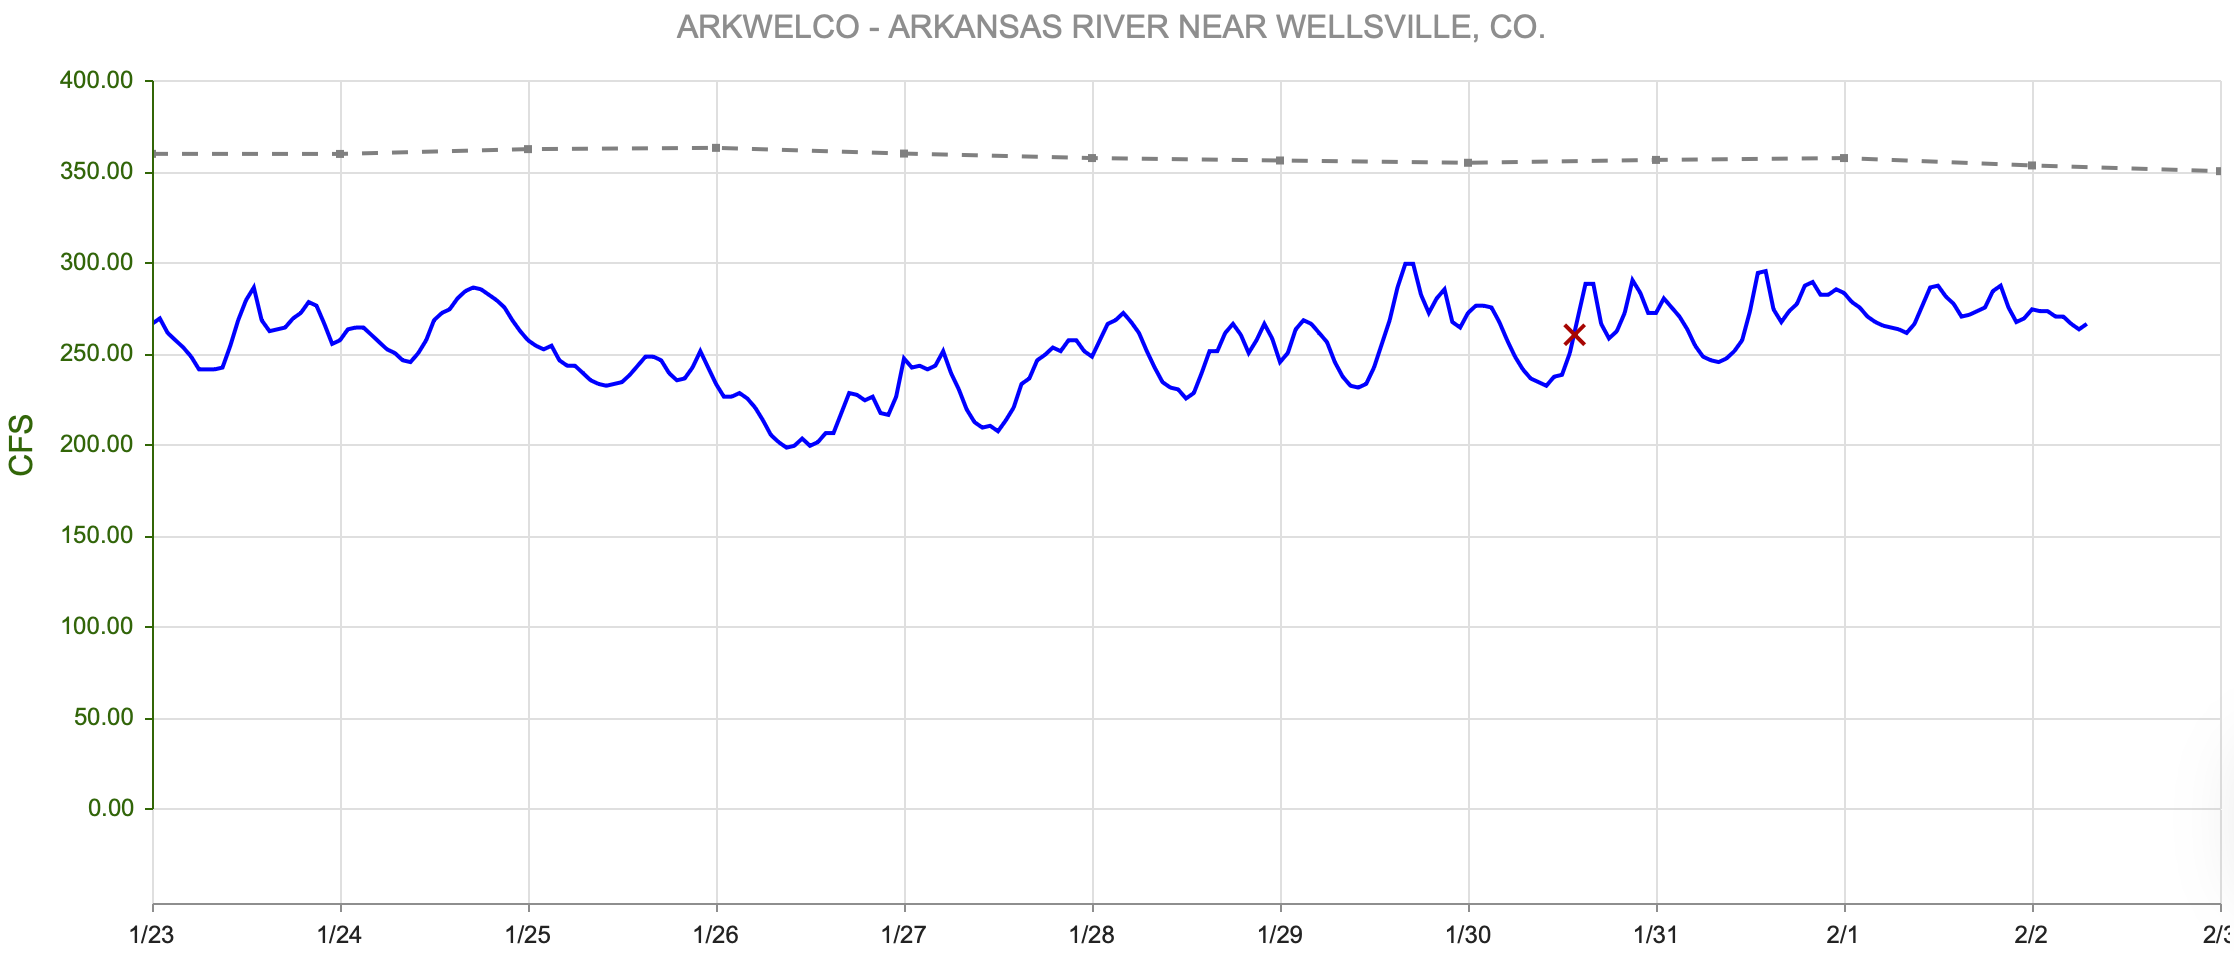
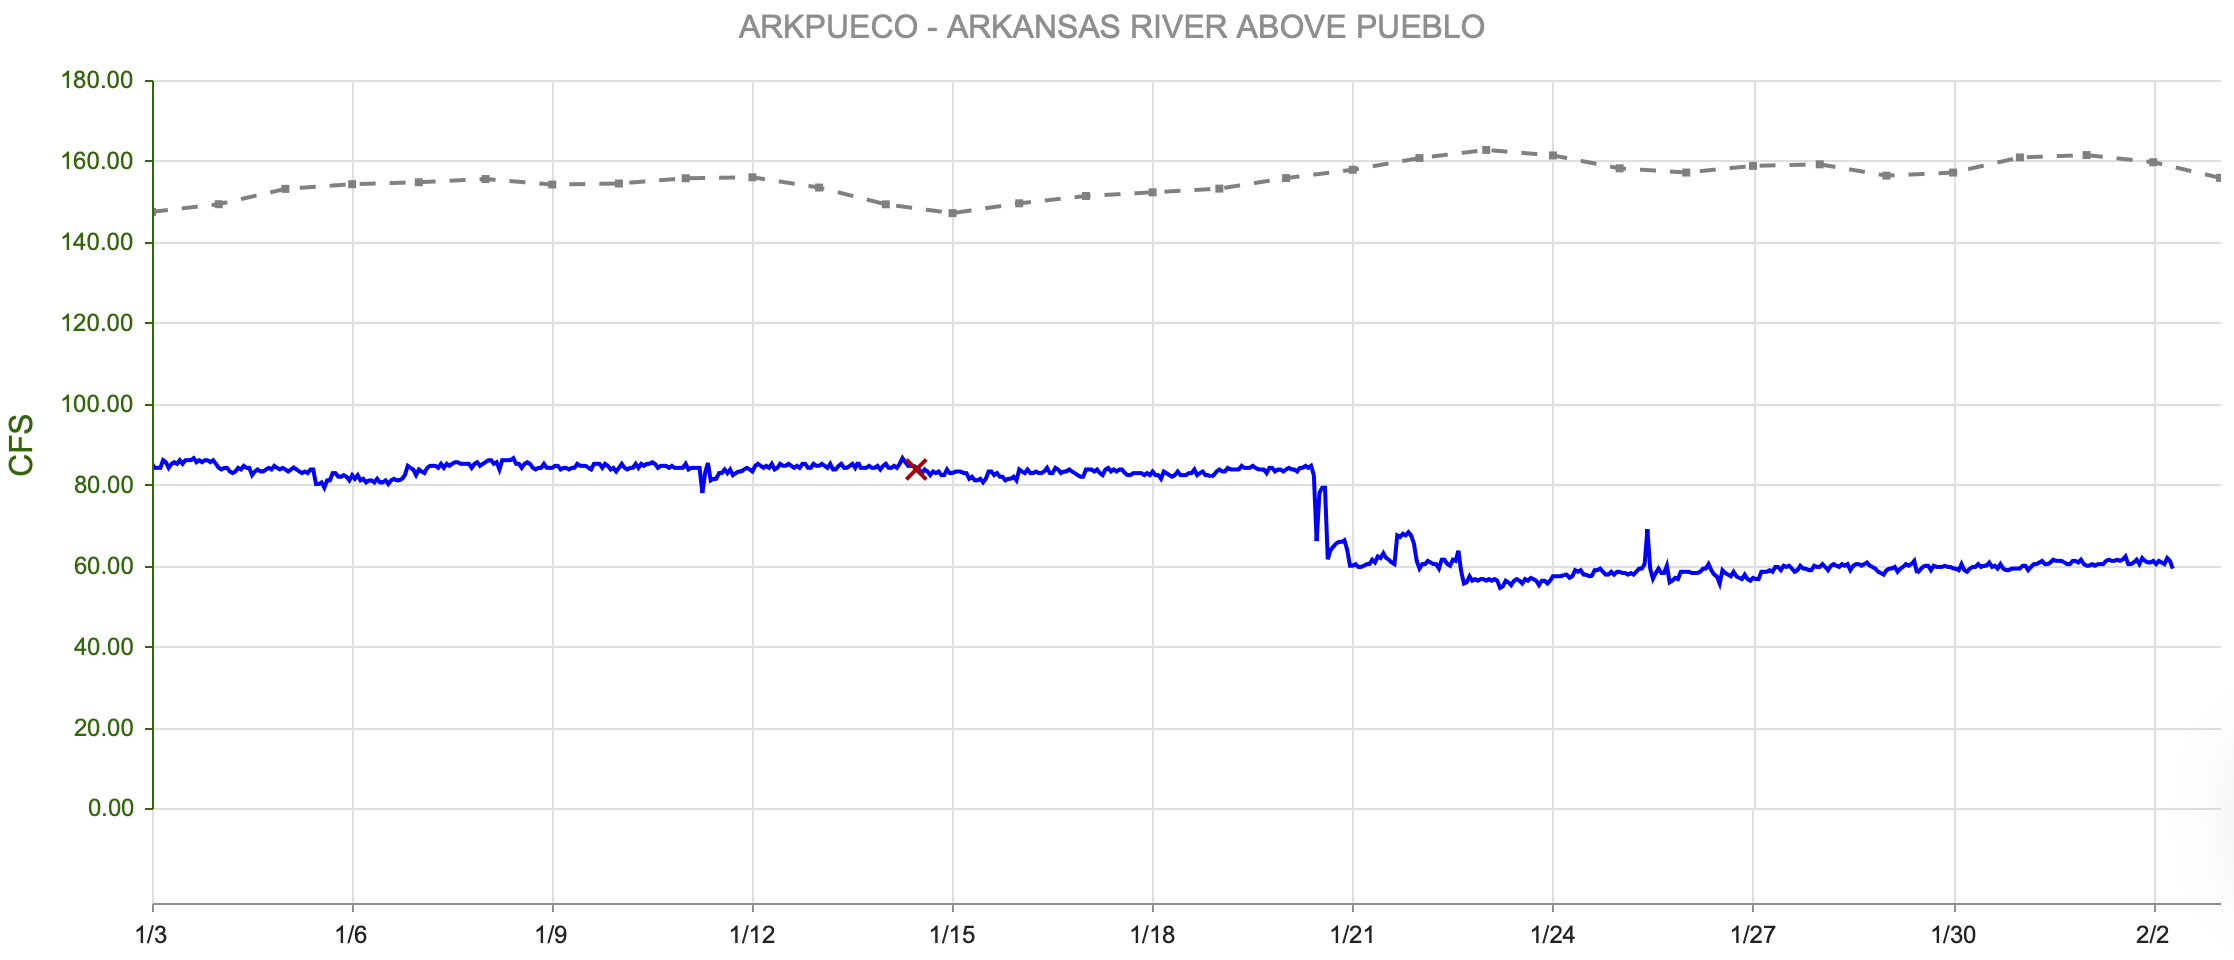
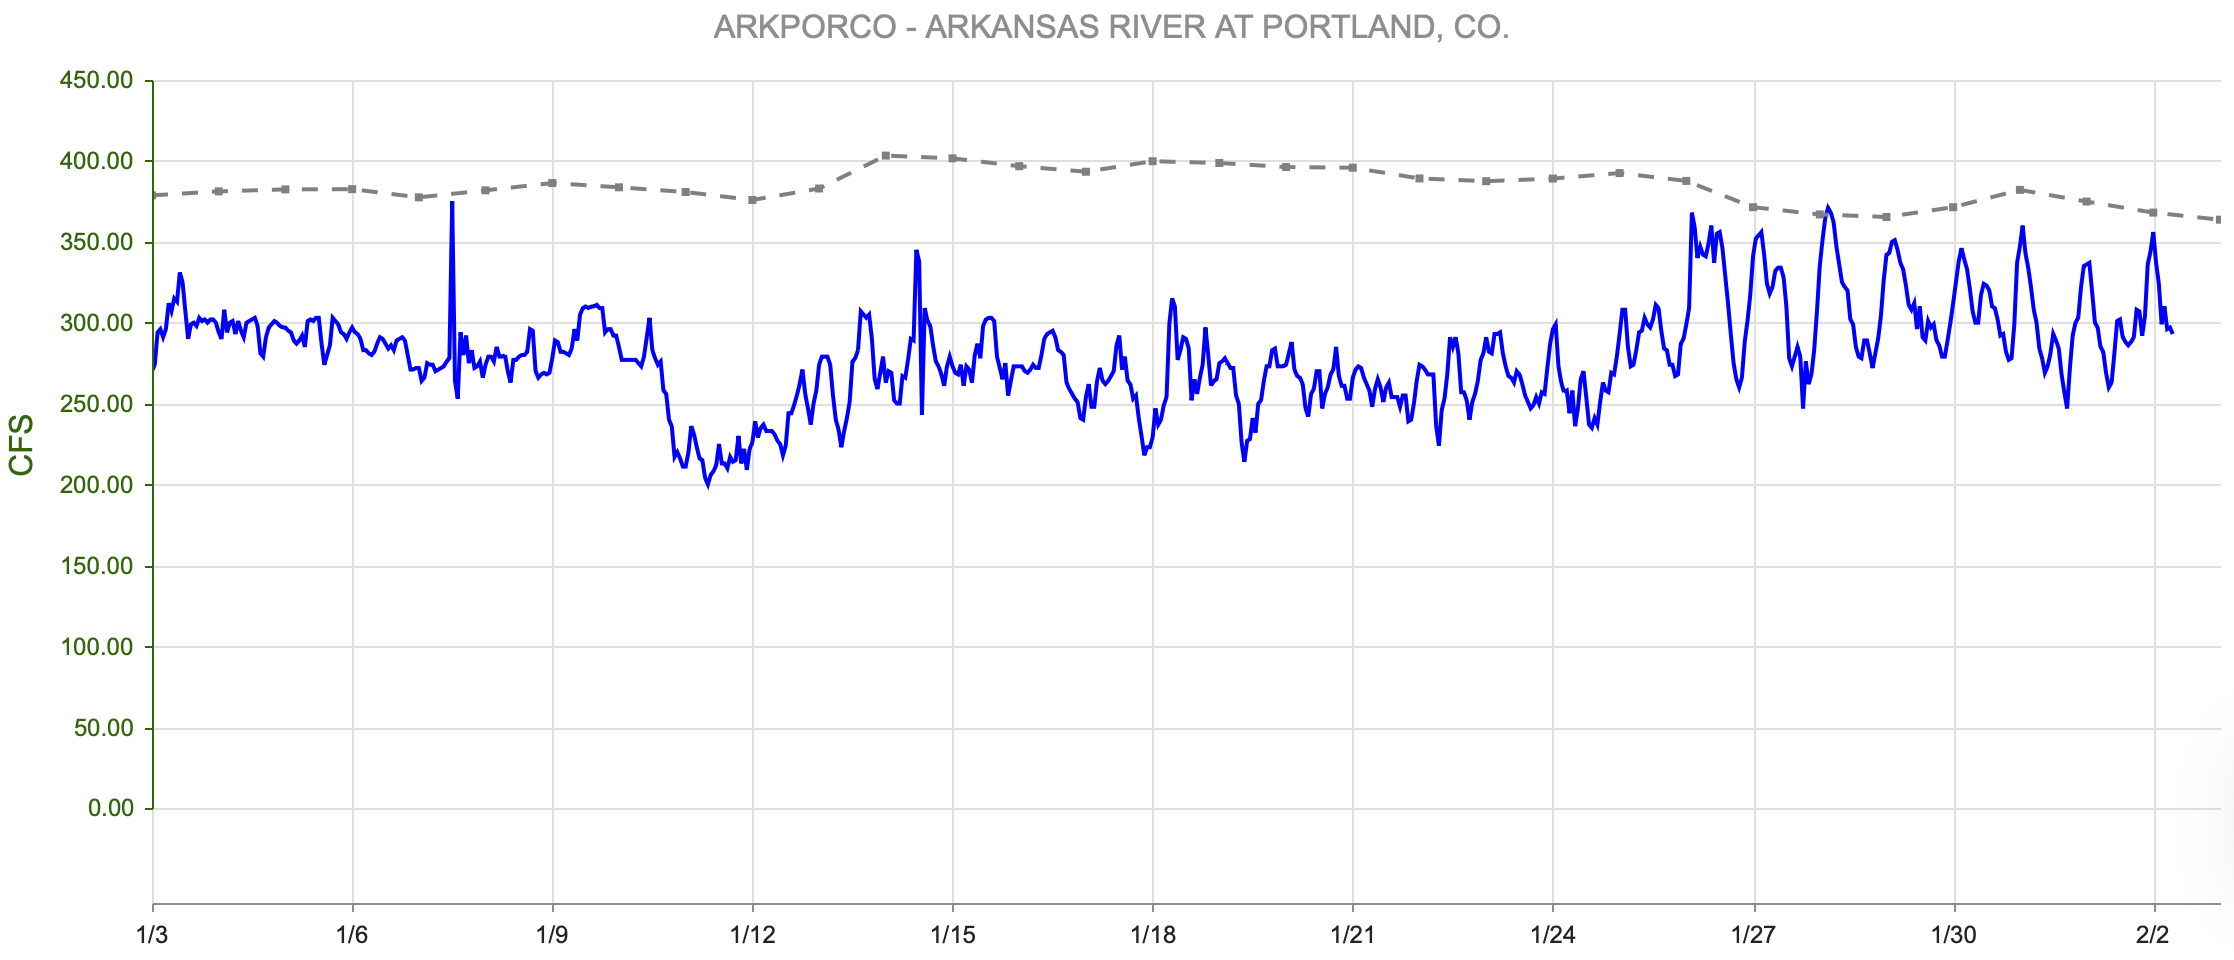
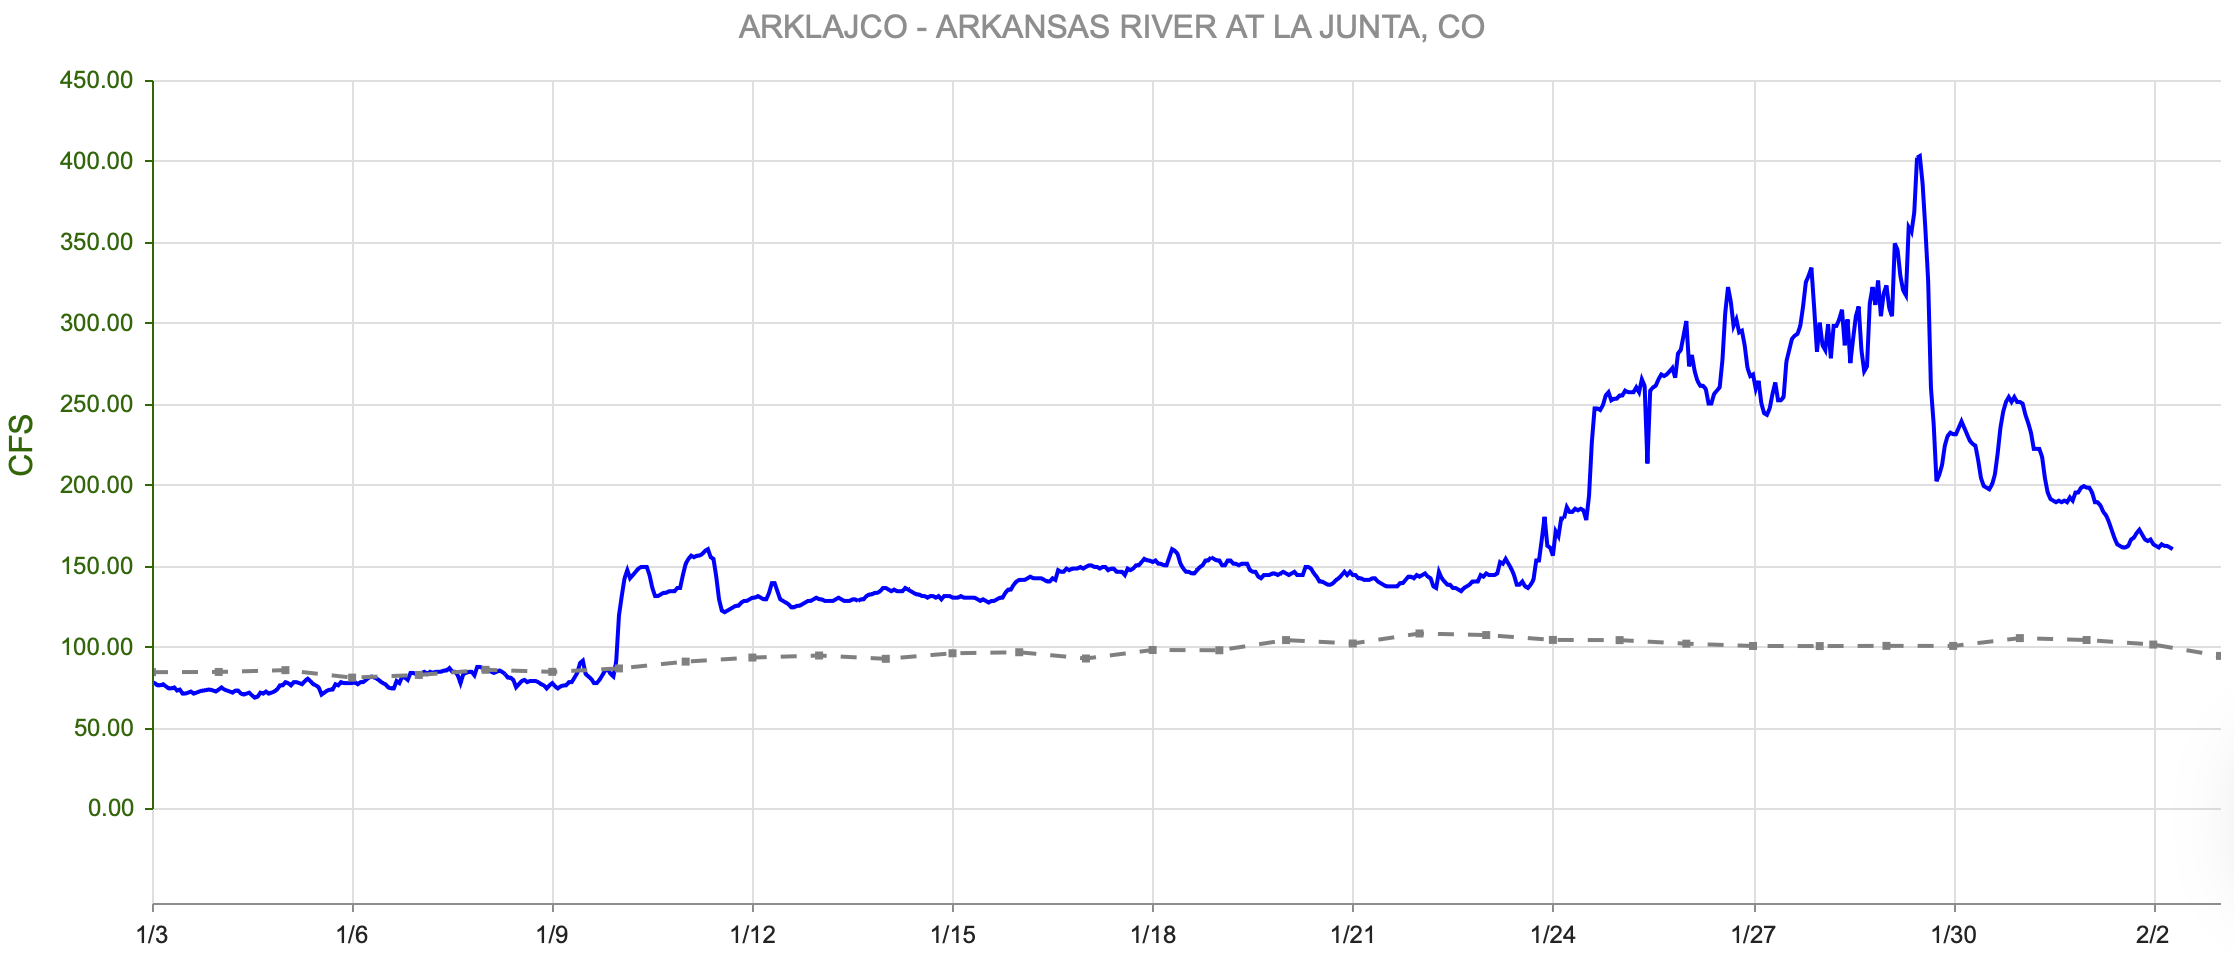
Streamflow Snapshot (2/2/2025; 10:00 am)
* measured flow totals include native flows, BOR project water, releases, and exchanges
Granite, CO (8 miles south of Leadville)- 238 cfs
Salida, CO- 242 cfs
Wellsville, CO- 274 cfs
Portland, CO (10 miles south of Canon City)- 299 cfs
Pueblo, CO- 60.8 cfs
Avondale, CO- 332 cfs
Lamar, CO- 20.1 cfs
For current streamflow updates, reference the Colors of Water webpage.
Reservoir Storage

figure 19: Reservoir Storage Percent of Median
Seasonal Outlook
Three-month temperature outlooks are leaning above average temperatures for the southwest portion of Colorado (figure 20). Temperatures are expected to rebound from the cold snap to near or slightly above average heading into February. Three-month precipitation outlooks are leaning below average precipitation for the southern and eastern portions of the state (figure 21).
La Niña conditions remain in place, though a transition to ENSO-neutral conditions is expected in late winter to early spring. There is an approximately 80 percent chance of neutral ENSO conditions between February and April (figure 23). Connections between ENSO-neutral phases and Colorado precipitation are weak, increasing forecast uncertainty for the remainder of the winter.

figure 20: Three Month Temperature Outlook

figure 21: Three Month Precipitation Outlook

figure 22: January Drought Outlook

figure 23: ENSO predictions
Want to Learn More? Check out these resources below!
Monitoring
Drought Monitoring: US Drought Monitor
Drought Forecast: National Weather Service Climate Prediction Center
Precipitation Totals: Community Collaborative Ran, Snow, and Hail Network’s Precipitation Mapping System.
Snowpack: Natural Resources Conservation Service
Winter Water Storage System (only applicable until march): Southeastern Colorado Water Conservancy District
Precipitation: https://www.cocorahs.org/
Arkansas River Daily Report – http://www.div2waterops.com/dailyreports
Arkansas Streamflow: http://www.div2waterops.com/ColorsOfWater
Snow Survey and Water Supply Forecasting: Natural Resource Conservation Service Snow Survey
Additional monitoring resources:
Colorado Water Conservation District/Department of Natural Resources
Definitions
30 Year Running Average: When we present the monthly flows, we compare them to that month’s median flows from the last 30 years (referred to as 30 year running average).
Reservoir Percent Full: The Bureau of Reclamation considers a reservoir “full” when pool elevation is at the top of the active conservation pool. Percentage is therefore based on total reservoir volume below that level.
Educational Resources
Administrative Call Explained: DWR
Citizen’s Guide to Colorado Water Law: CFWE Education
Non-Attorney’s Guidebook to Colorado Water Courts: Co State
Voluntary Flow Management
- https://arkvalleyvoice.com/ahra-says-arkansas-river-flows-are-high-and-fast-making-safety-paramount/
- https://coloradotu.org/arkansas-river
U.S. Climate Normals: https://www.ncei.noaa.gov/products/land-based-station/us-climate-normals
