
Temperature Trends
July 2025 in Colorado brought a noticeable contrast in temperature patterns across the state, particularly in relation to the Continental Divide (figure 1). Areas west of the divide experienced above-average temperatures, with persistent warmth driven in part by reduced cloud cover and drier-than-normal conditions. This warmth was especially pronounced in higher elevation zones and the Western Slope, where daytime highs consistently exceeded seasonal norms. In contrast, much of eastern Colorado saw average to below-average temperatures for the month. This was particularly true in the lower Arkansas River Basin, where several stretches experienced a cooler-than-usual July. The cooler conditions in the southeast were likely influenced by increased moisture and cloudiness from early-season monsoonal activity, which helped moderate daytime temperatures and support slightly cooler overall conditions compared to historical averages.

Figure 1: July 2025 Average Monthly Temperatures Compared to Normal
Drought & Precipitation
Similar to temperature trends, the past two months have highlighted a stark divide in moisture conditions across Colorado. Thunderstorm complexes in June and July brought localized relief to the Northeast and the Arkansas River Valley, contributing to notable drought improvement across the eastern plains. However, western Colorado has experienced rapid drought onset, with continued dryness west of the Continental Divide.
As of July 20th:
-
Water year-to-date precipitation stands at 85% of average statewide
-
30-day precipitation is at 58% of average
-
60-day precipitation is at 77% of average
-
20-inch soil moisture is 22%, but overall conditions are near normal at 92% of median
Despite these statewide averages, the Western Slope is seeing increasing drought severity, with many areas falling into D2 (severe) to D3 (extreme) drought categories (figure 2). Streamflows remain low, though not yet at the severity implied by those drought designations. Rather, the classification reflects moderate short-term dryness compounding long-term drought stress.
Recent precipitation patterns reflect an increasingly unusual east/west wet–dry split (figure 3; 4). This seasonal divide is not uncommon, but it has been especially pronounced this year. Looking ahead, the next three weeks mark a critical periodfor monsoon and flash flood activity, which could bring relief—or compound deficits depending on storm track.

figure 2: Colorado Drought Monitor

figure 3: Colorado 180-day Standard Precipitation Index

figure 4: 28-Day Precipitation as Percent of Median
July Precipitation Totals
Leadville-1.42 in
Buena Vista-0.82 in
Salida-1.81 in
Cañon City-2.42 in
Pueblo -1.67 in
Rocky Ford-2.17 in
Lamar-2.55 in
Streamflow
July streamflow has been average or slightly below average in the Arkansas River Basin. In the Upper Arkansas, this is due to the Upper Arkansas Voluntary Flow Management Program.
The Upper Arkansas Voluntary Flow Management Program (VFMP) is a collaborative water management initiative designed to support recreational boating and fisheries along the Arkansas River —particularly in the Upper Arkansas Valley and through the Arkansas Headwaters Recreation Area (AHRA). Through this program, flows are maintained at a minimum of ~700 cfs at the Wellsville gauge between July 1st and August 15th. If native runoff falls below that level, transbasin water diverted from the Western Slope via the Fryingpan–Arkansas Project—from reservoirs like Turquoise Lake and Twin Lakes—is released to augment the flow.

figure 5: Map of 28-day average streamflow compared to historical median
July Streamflow Summary
* measured flow totals include native flows, BOR project water, releases, and exchanges

figure 6: Map of river gauges in the Arkansas River Basin
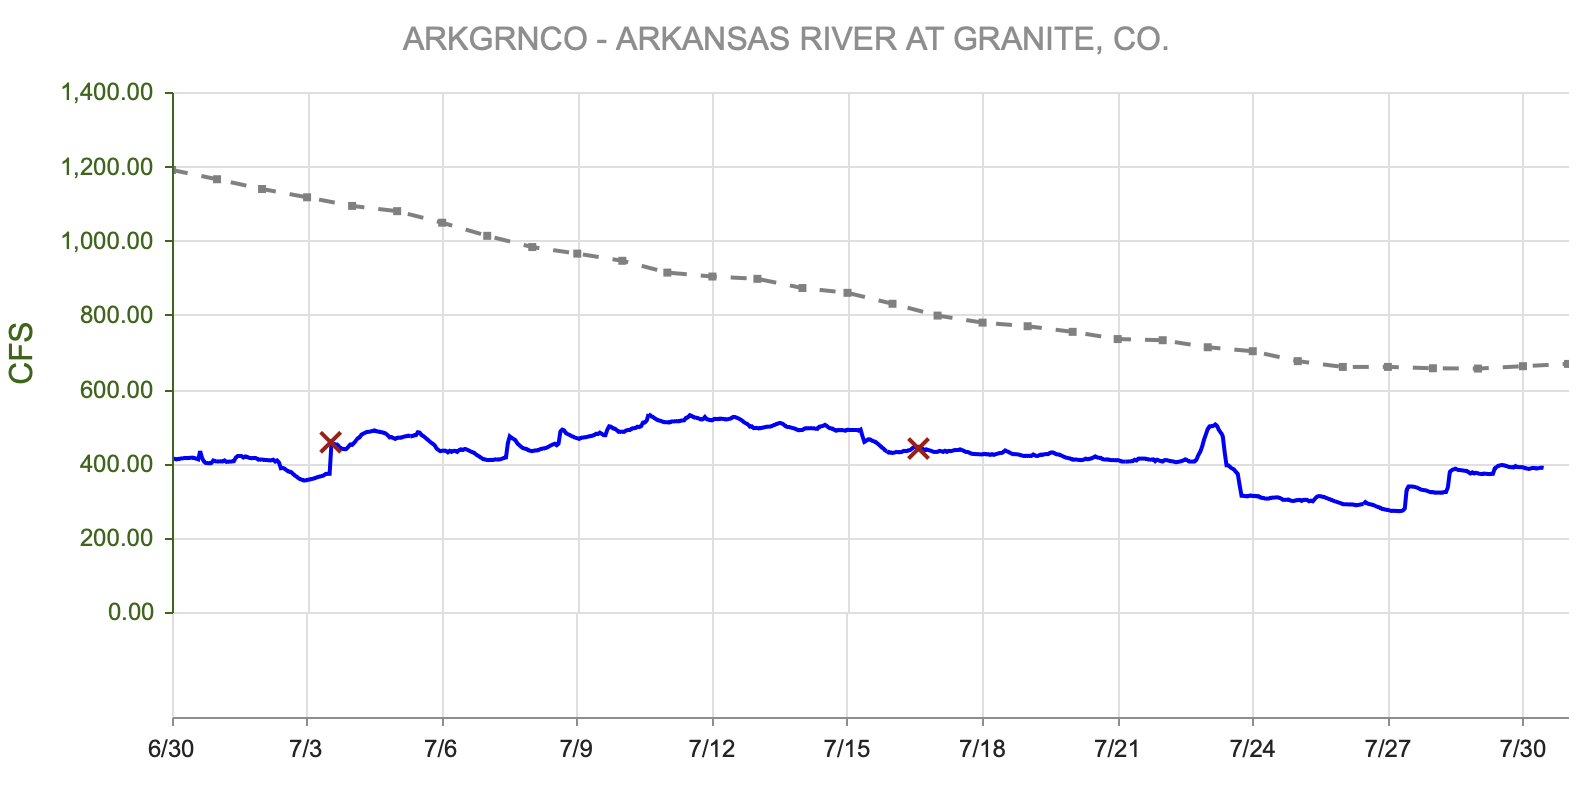
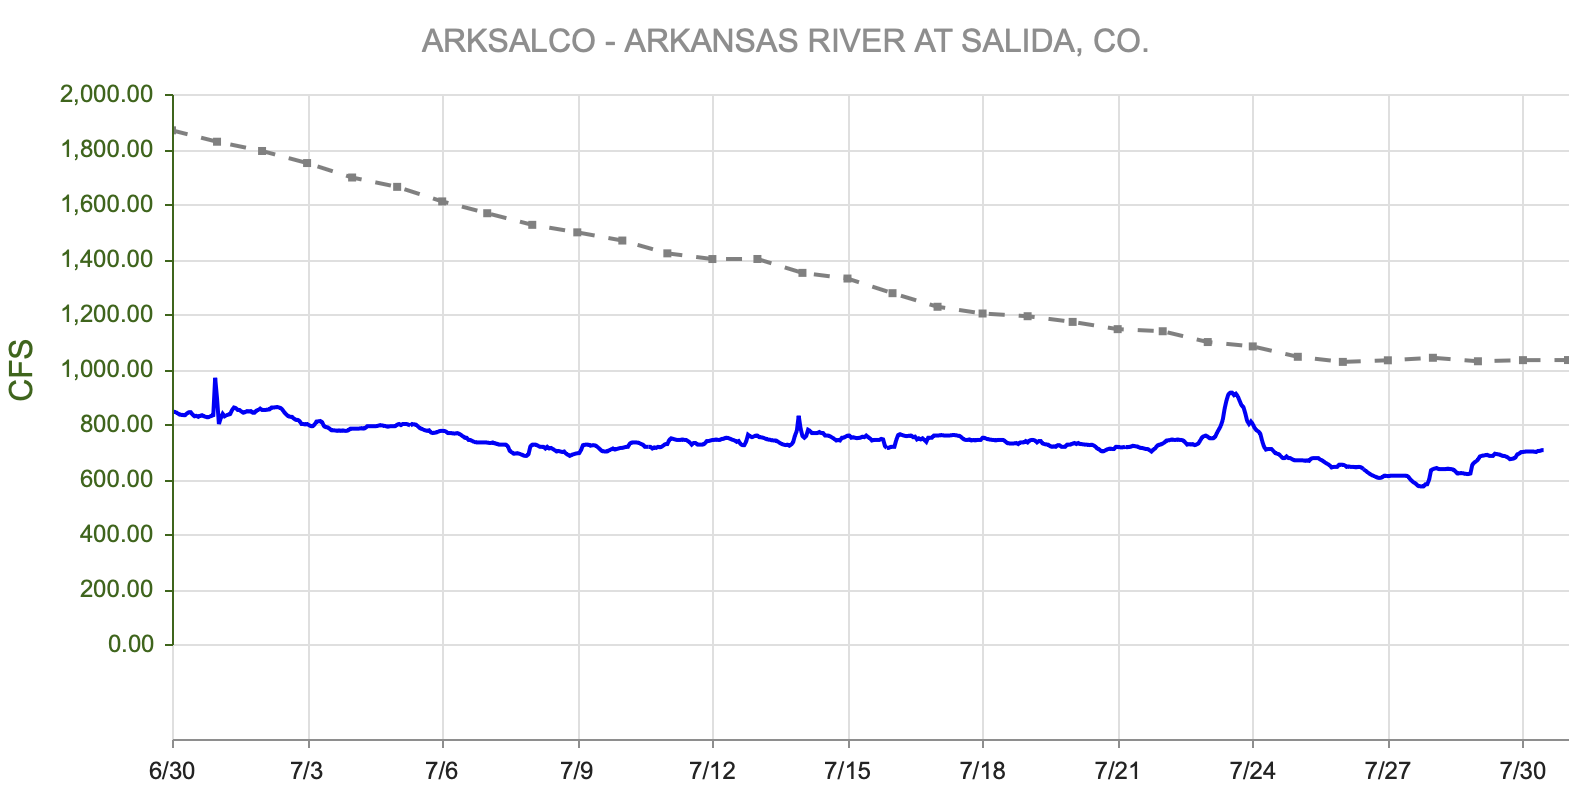
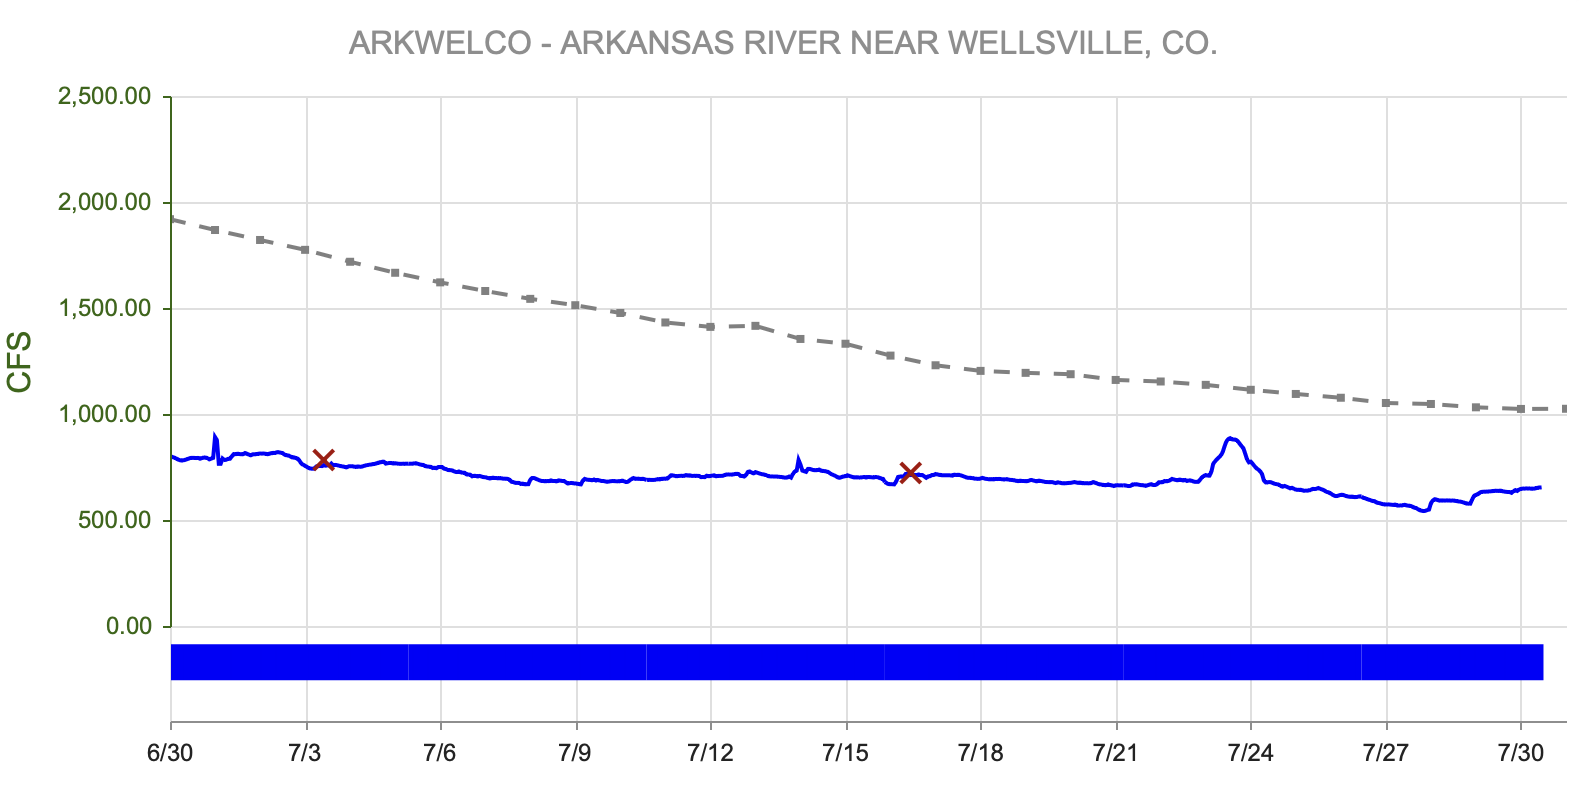
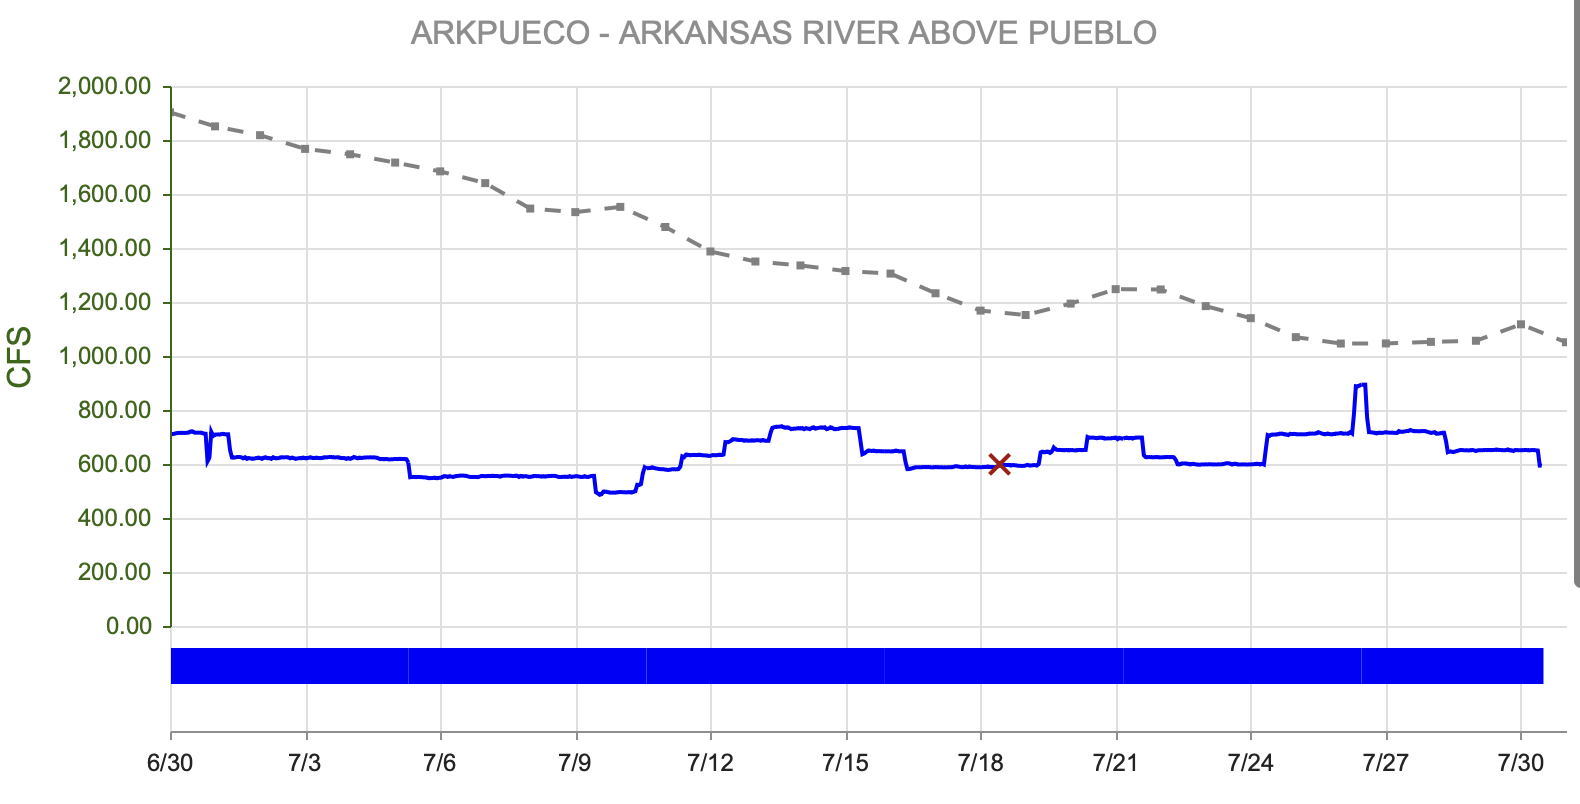
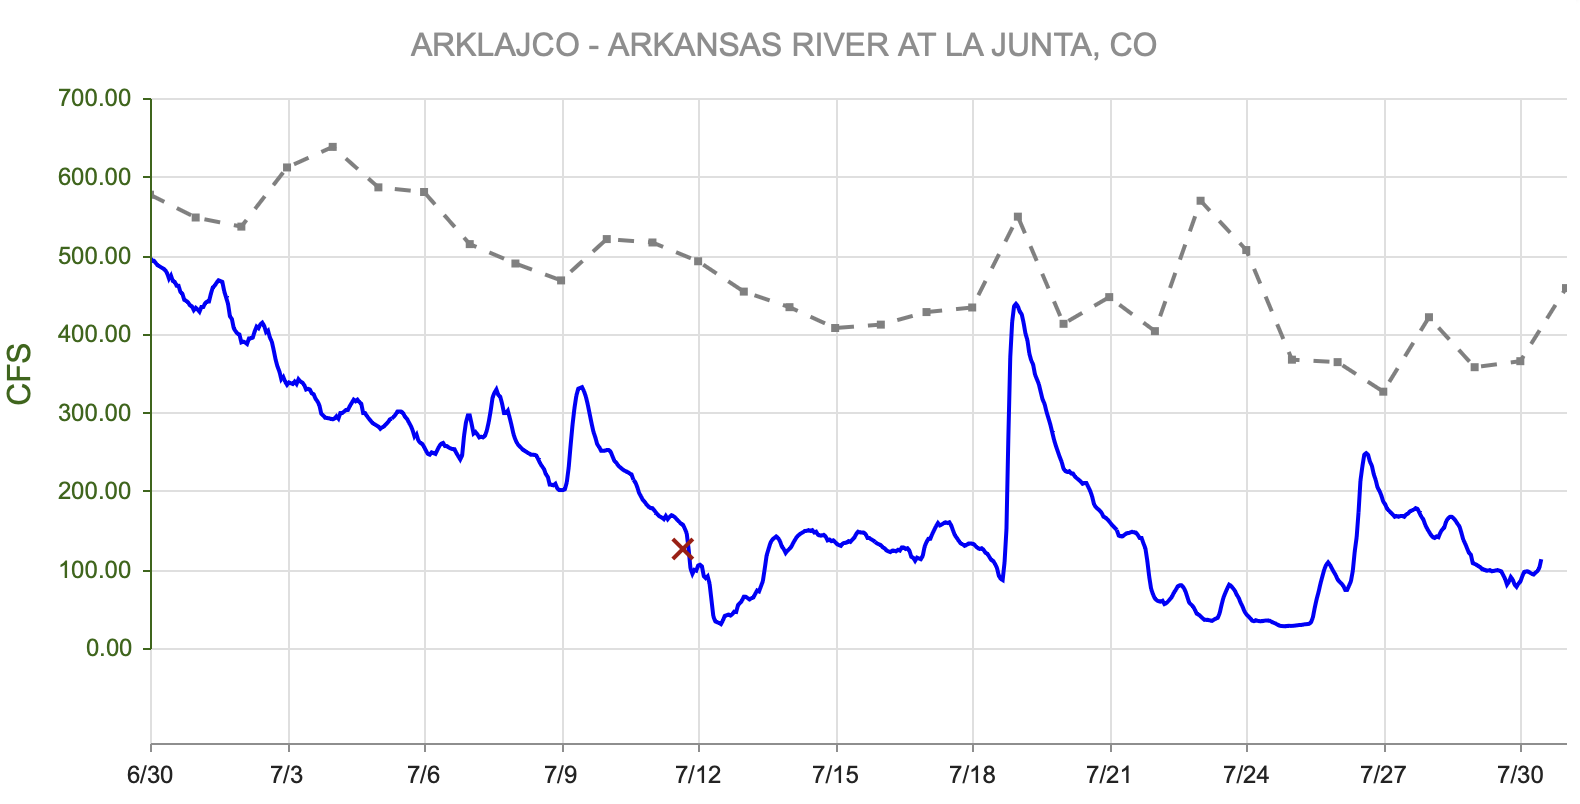
figure 6: Arkansas River Flows Upstream to Downstream Viewer
- Granite, CO (8 miles south of Leadville)- 355 cfs
- Salida, CO- 657 cfs
- Wellsville, CO- 617 cfs
- Portland, CO (10 miles south of Canon City)- 590 cfs
- Above Pueblo Reservoir, CO- 566 cfs
- Avondale, CO- 865 cfs
- Lamar, CO- 331 cfs
For current streamflow updates, reference the Colors of Water webpage.
Reservoir Storage

figure 7: Reservoir Storage Percent of Median
Summer/Fall Outlook
Climate models continue to favor above-normal temperatures and below-normal precipitation, particularly for western Colorado and the northern Great Plains. Notably, this trend has appeared even in models not directly tied to La Niña, especially in early fall when year-to-year variability tends to be lower than in spring.
Without a strong monsoonal pattern, wildfire risk and water supply stress will remain elevated across western Colorado this summer. Continued monitoring will be critical as we move through the peak of monsoon season.

figure 8: Three Month Temperature Outlook

figure 9: Three Month Precipitation Outlook
Want to Learn More? Check out these resources below!
Monitoring
Drought Monitoring: US Drought Monitor
Drought Forecast: National Weather Service Climate Prediction Center
Precipitation Totals: Community Collaborative Ran, Snow, and Hail Network’s Precipitation Mapping System.
Snowpack: Natural Resources Conservation Service
Winter Water Storage System (only applicable until march): Southeastern Colorado Water Conservancy District
Precipitation: https://www.cocorahs.org/
Arkansas River Daily Report – http://www.div2waterops.com/dailyreports
Arkansas Streamflow: http://www.div2waterops.com/ColorsOfWater
Snow Survey and Water Supply Forecasting: Natural Resource Conservation Service Snow Survey
Additional monitoring resources:
Colorado Water Conservation District/Department of Natural Resources
Definitions
30 Year Running Average: When we present the monthly flows, we compare them to that month’s median flows from the last 30 years (referred to as 30 year running average).
Reservoir Percent Full: The Bureau of Reclamation considers a reservoir “full” when pool elevation is at the top of the active conservation pool. Percentage is therefore based on total reservoir volume below that level.
Educational Resources
Administrative Call Explained: DWR
Citizen’s Guide to Colorado Water Law: CFWE Education
Non-Attorney’s Guidebook to Colorado Water Courts: Co State
Voluntary Flow Management
- https://arkvalleyvoice.com/ahra-says-arkansas-river-flows-are-high-and-fast-making-safety-paramount/
- https://coloradotu.org/arkansas-river
U.S. Climate Normals: https://www.ncei.noaa.gov/products/land-based-station/us-climate-normals