
I’ve woken up the past few mornings with the strange sensation that I’ve somehow time-traveled to spring. Or teleported to California. Warm, dry wind pushes through my bedroom window, and the birds gossip noisily with their companions in the canopy.
The historically dry winter has started to feel like old news. But I am becoming aware of another, equally unsettling reality: Water Year 2026 is now the warmest first four months of a water year in 131 years of record — and not by a small margin (figure 1).

Temperature Trends
Water Year 2026 is approximately 5°F warmer than the 1991–2020 average and 1.7°F warmer than the previous record set in 2018, according to Russ Schumacher, professor of atmospheric science at Colorado State University and the state climatologist (figure 2; figure 3). Time periods ending in January across 3- to 24-month scales rank as the warmest on record statewide (figure 4). Although a brief cold snap between January 24–26 brought sub-zero temperatures to parts of the eastern plains and mountains, January overall remained well above average, with numerous daily minimum and maximum temperature records broken.
Low-elevation snow cover remains minimal, which is contributing to warmer daytime temperatures and elevated evaporative demand. February wrapped up with another anomalously warm spell across much of the state (figure 5).

figure 2: Temperature Rank Oct 2025-Jan 2026

figure 3: Temperature Rank Oct 2025-Jan 2026

figure 4: Temp Rankings

figure 5: WY2026 Temps Compared to 1991-2020 average
Drought & Precipitation
Colorado is currently experiencing some of the most severe drought conditions in the western United States (figure 6; figure 7). The Evaporative Demand Drought Index (EDDI) has remained high statewide over the past three months, particularly in northeast and northwest Colorado, driven largely by record warmth (figure 8). At this point in the year, the U.S. Drought Monitor continues to weigh snowpack and water year-to-date precipitation heavily in its assessments.

figure 6: Colorado Drought Monitor

figure 7: Western US Drought Monitor

figure 8: Evaportative Demand Drought Index

figure 9: WY2026 Accumulated precipitation compared to 30 year average
Snowpack
February brought a welcome shift in the weather pattern, but Colorado remains well behind where we should be heading into the final stretch of snow accumulation season (figure 10). A series of late-winter storms added a fair amount of snow across the state, improving short-term conditions. Still, with roughly 40 days remaining until our typical peak snowpack around April 8, both the Arkansas River Basin and the entire state of Colorado remain in a precarious position (figure 11).
Statewide water year-to-date precipitation stands at 82% of median, ranking WY 2026 as the 33rd driest start to a water year. Large portions of western Colorado have experienced near-record low precipitation over the past year. While 30-day precipitation totals have improved due to February storms, long-term deficits persist.
Statewide snow water equivalent (SWE) has improved from 52% of median earlier this month to 62% of median by the end of February. Median SWE for today is 12.1 inches; current statewide SWE sits at 7.6 inches. February storms added approximately 2 inches of SWE statewide. This is meaningful progress, but not enough to erase deep deficits.
Water Year 2026 now ranks 45th out of 46 years in the period of record for statewide snowpack. Only 1981 was lower at this point in the season. Current conditions are tracking closely to 2002 (another drought year) and remain slightly below 2002 totals. While this year is about 1.6–1.8 inches better than 1977 and 1981 at this stage, recovery to median snowpack levels would require sustained, well above-normal precipitation through March and early April. Even optimistic projections keep peak snowpack below median without a dramatic pattern shift.

figure 11: SWE Ranked over WY1982-2026
The Arkansas River Basin continues to lag behind the rest of the state. While most Colorado basins now fall within 50–69% of median, the Arkansas remains the only basin below 50%, currently sitting near 45% of median (figure 12).
Some datasets show a short-term improvement following February storms, but overall basin conditions remain the weakest statewide. Southern Colorado basins continue to show the largest departures from normal, and upcoming storm systems are expected to favor northern mountains, potentially leaving the southern ranges drier.

figure 12: Arkansas River Basin SWE (data glitch on March 1)
February Precipitation Totals
Leadville-0.60″
Buena Vista-0.28″
Cañon City-0.16″
Salida-0.19″
Pueblo -0.34″
La Junta-0.71″
Lamar-0.37″
Soil Moisture
Despite snow deficits, soil moisture conditions remain near normal in many areas (figure 13). October rainfall and early-season storms helped recharge soils, providing a modest buffer entering peak snow accumulation season. Early snowmelt may also have contributed to maintaining near-normal soil moisture levels. However, without continued precipitation, soils could dry quickly as temperatures rise.

figure 13: 1-Meter Soil Moisture
Streamflow
February is typically a low streamflow month in Colorado, when water is still being stored as snowpack and has not yet begun to melt significantly into the rivers. Streamflows remain around average for this time of year (figure 14; figure 15). The broader seasonal outlook leans drier than average, increasing the likelihood of below-median runoff this spring (figure 16).

figure 14: Streamflow Compared to Historic Average
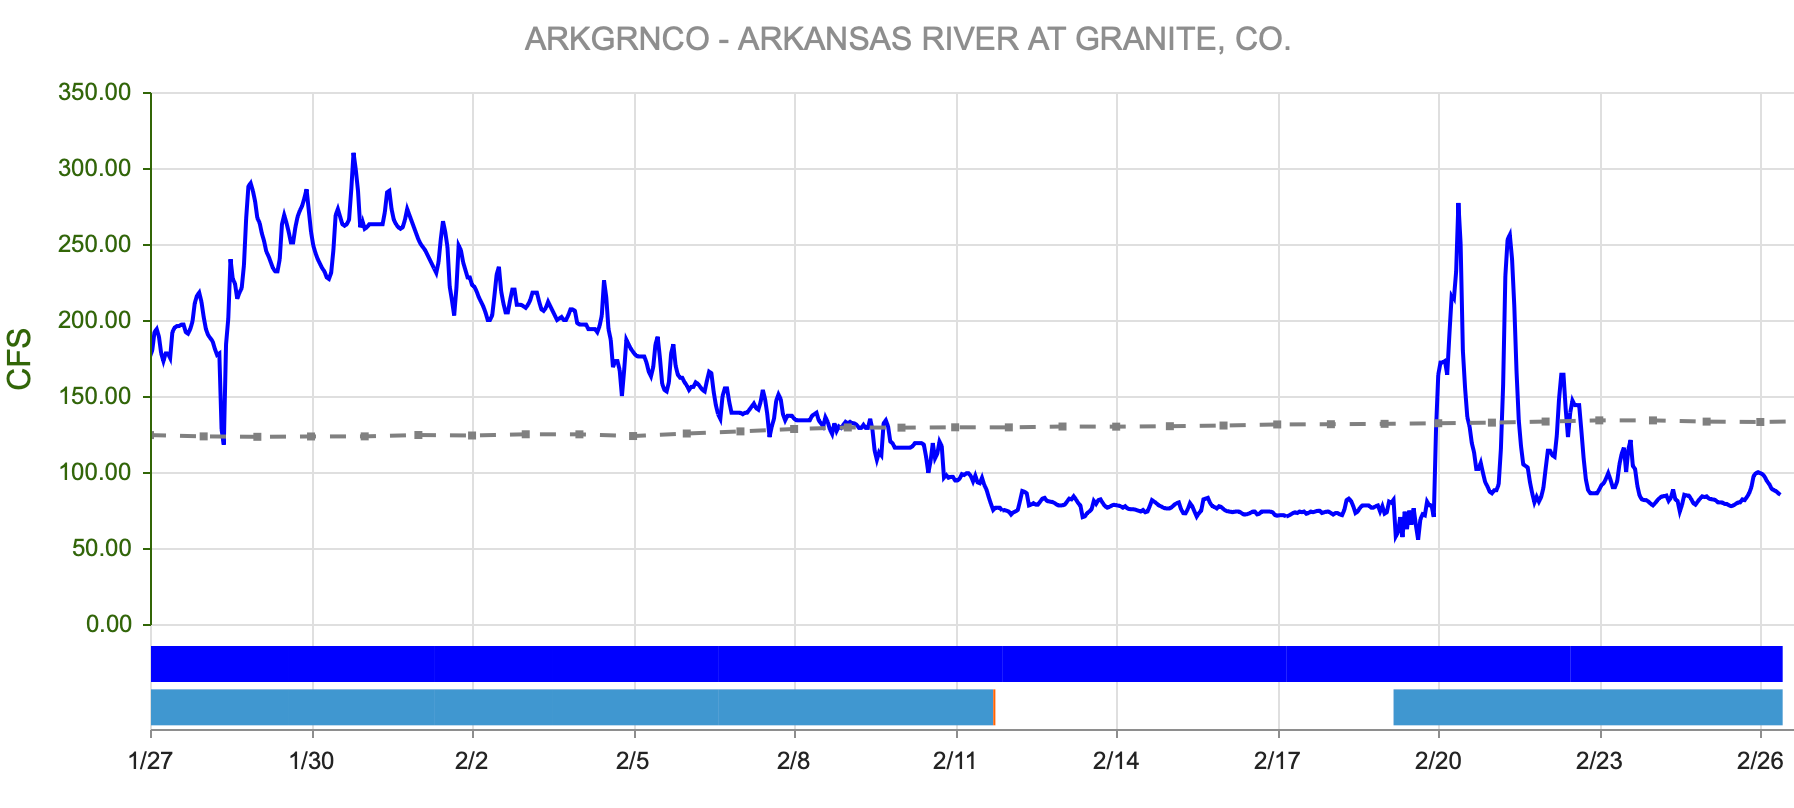
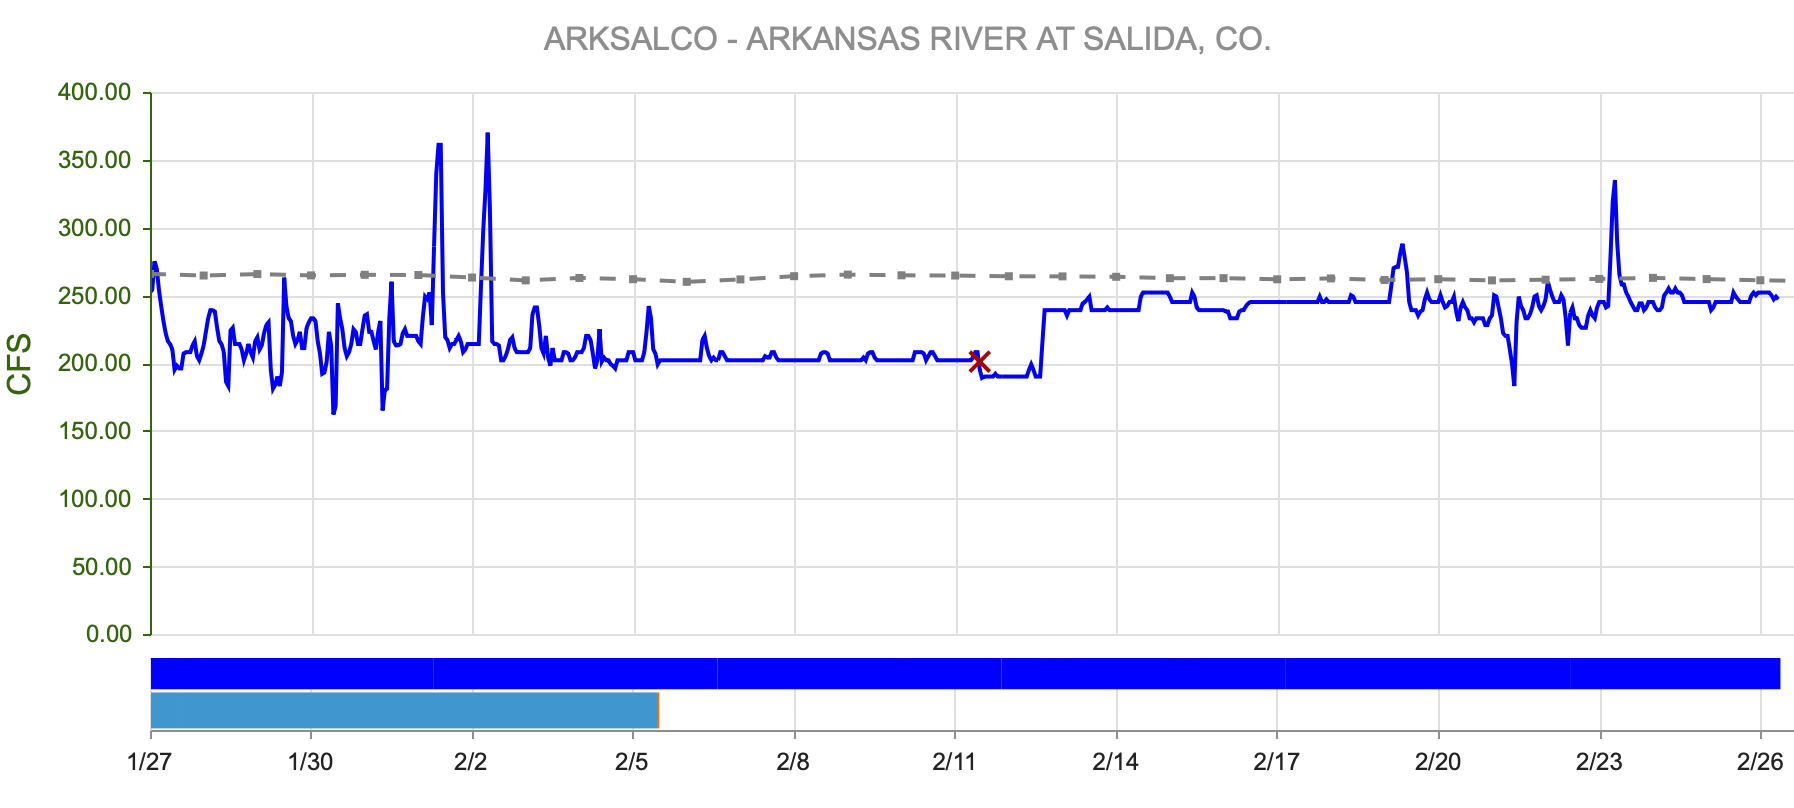
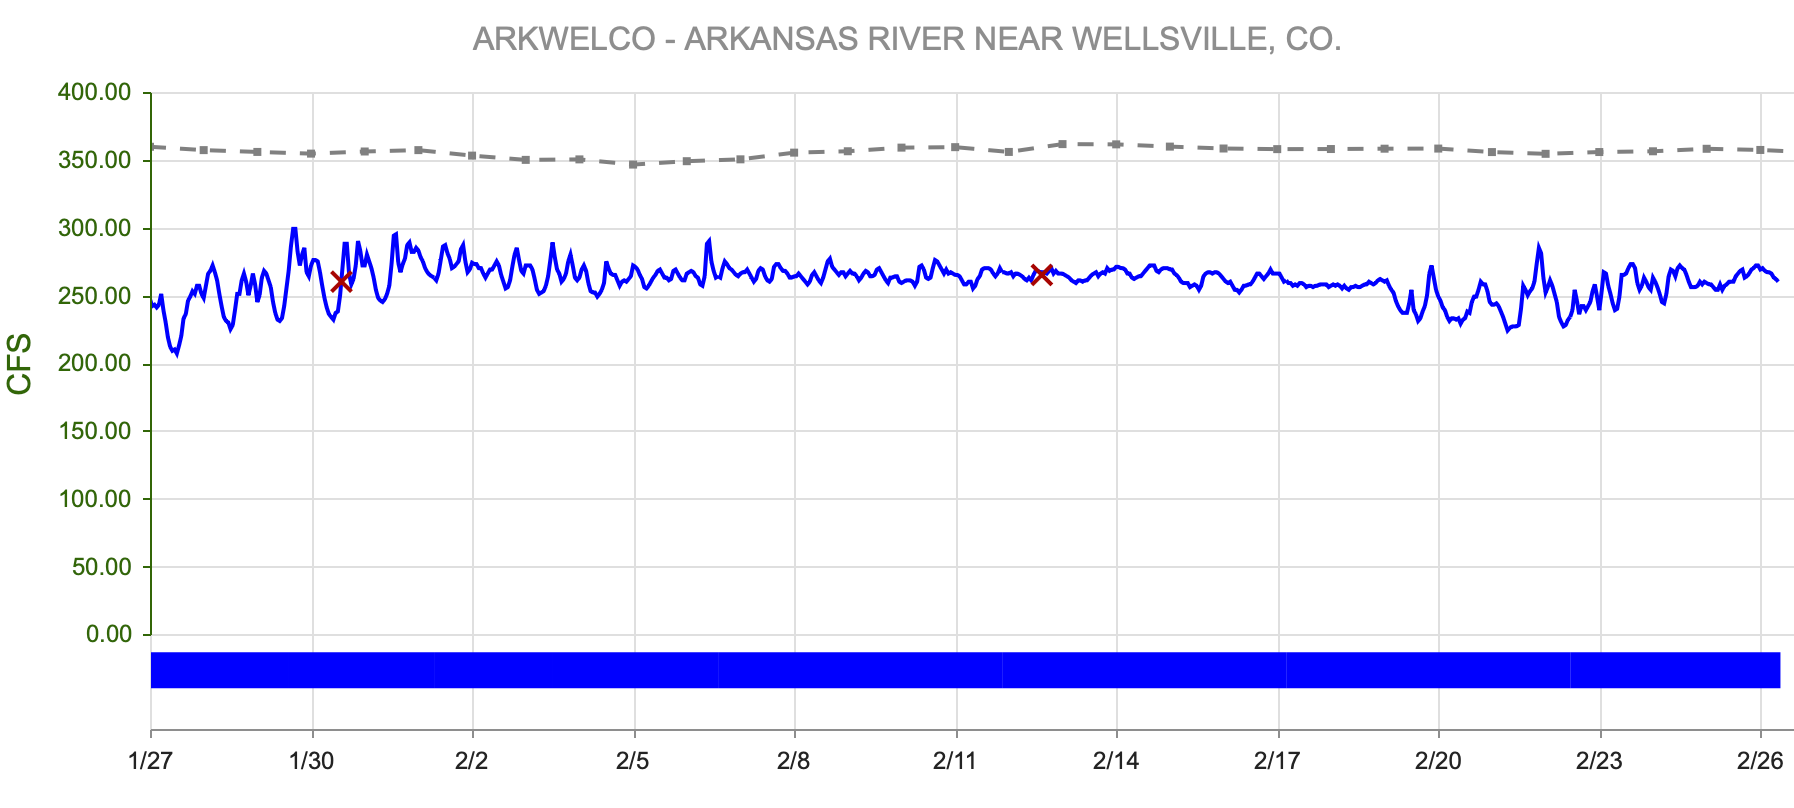
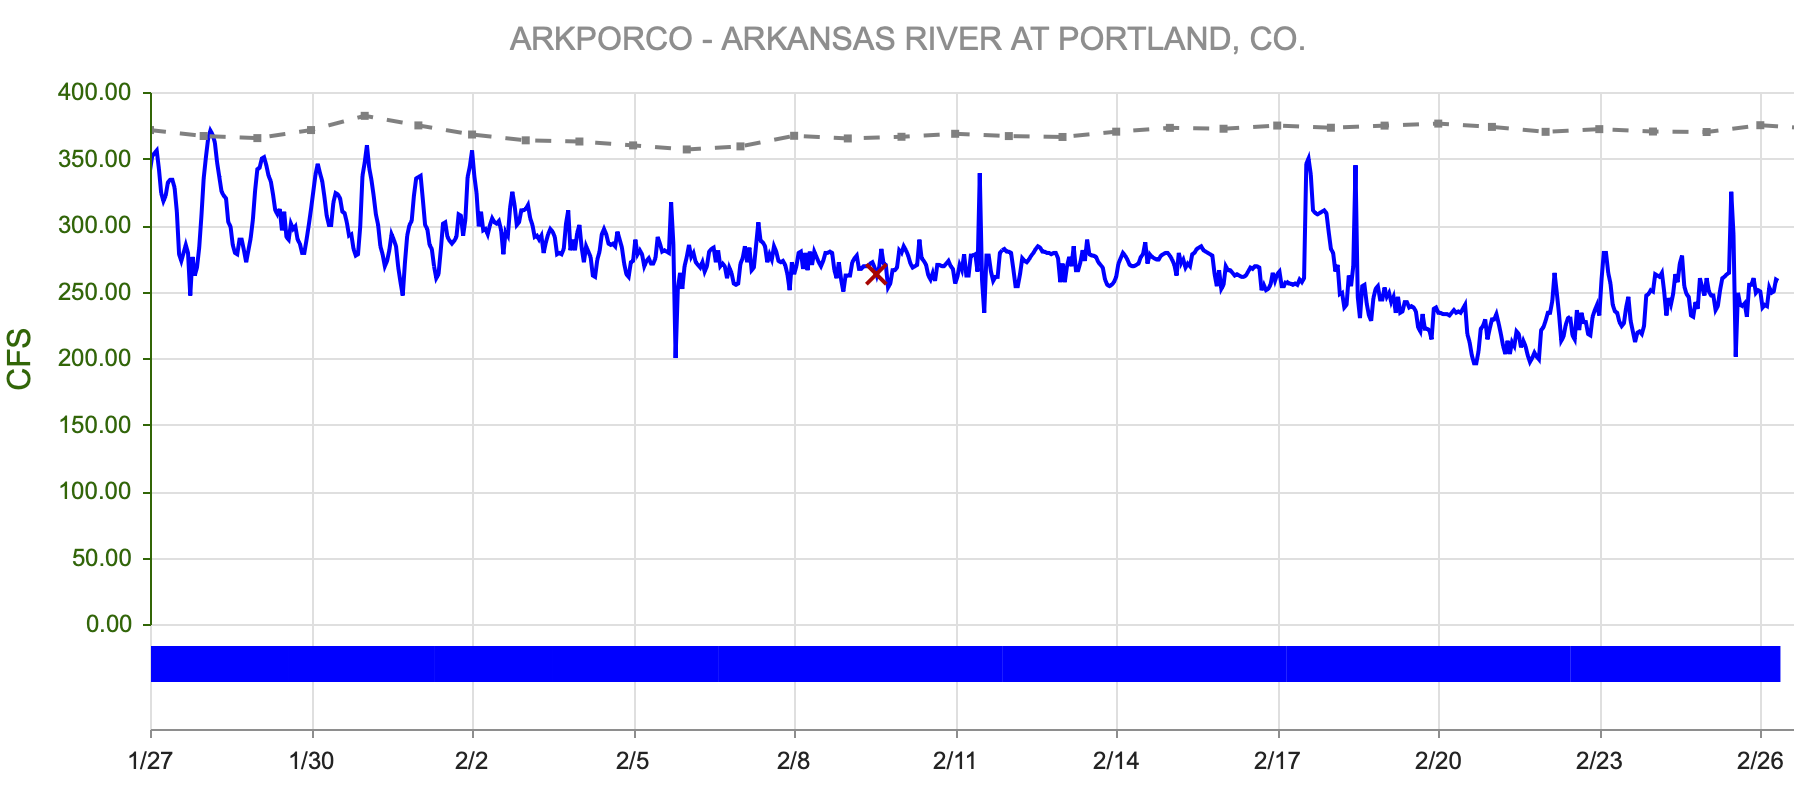
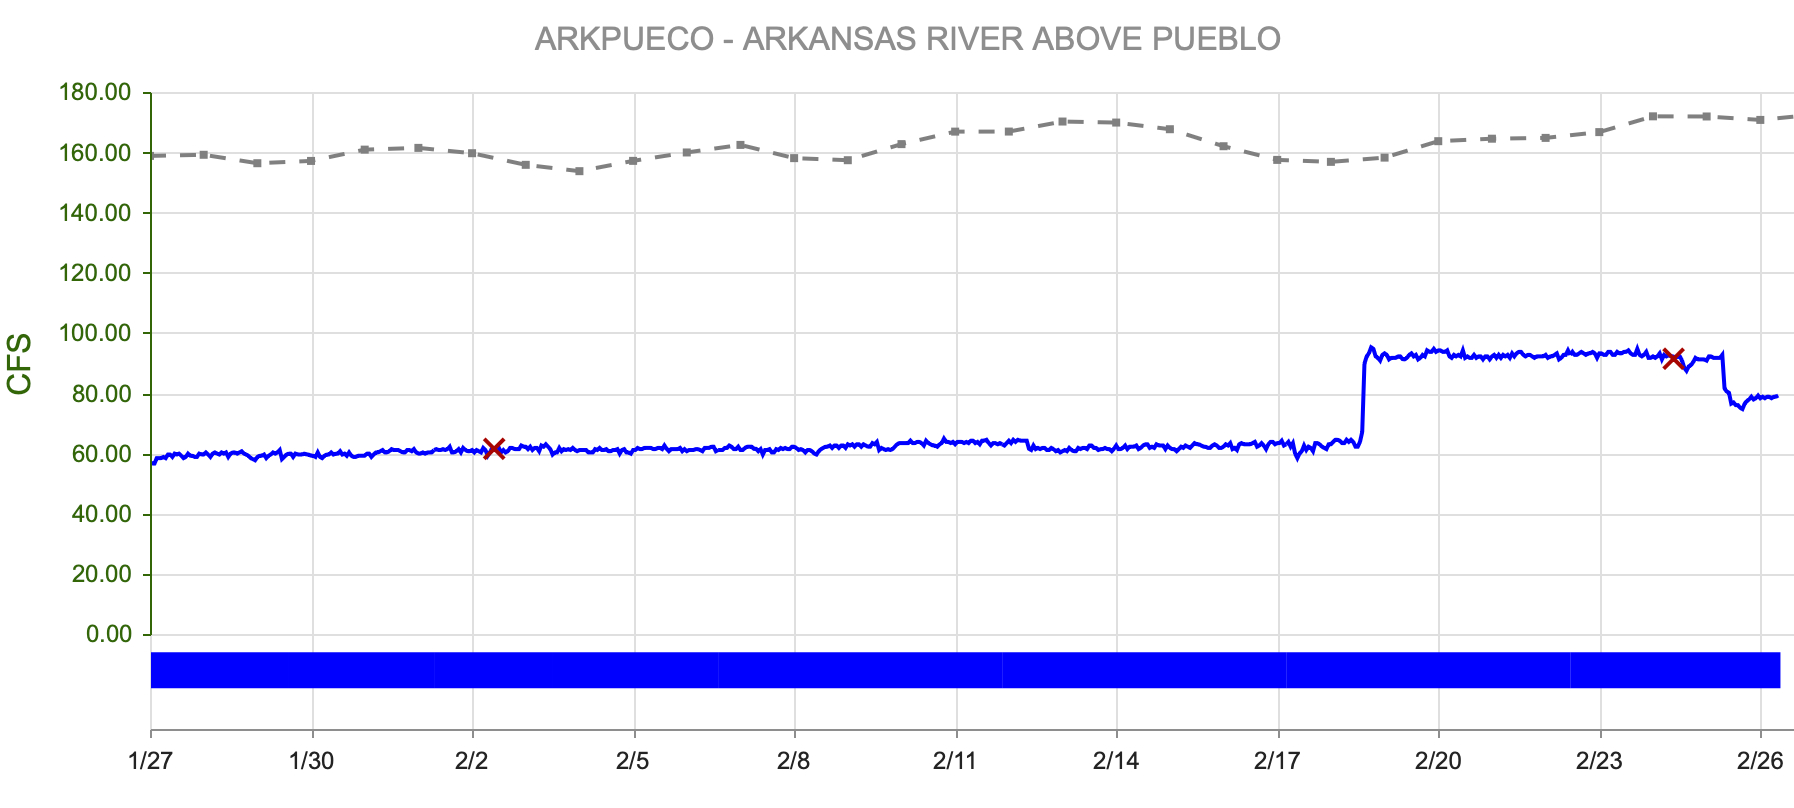
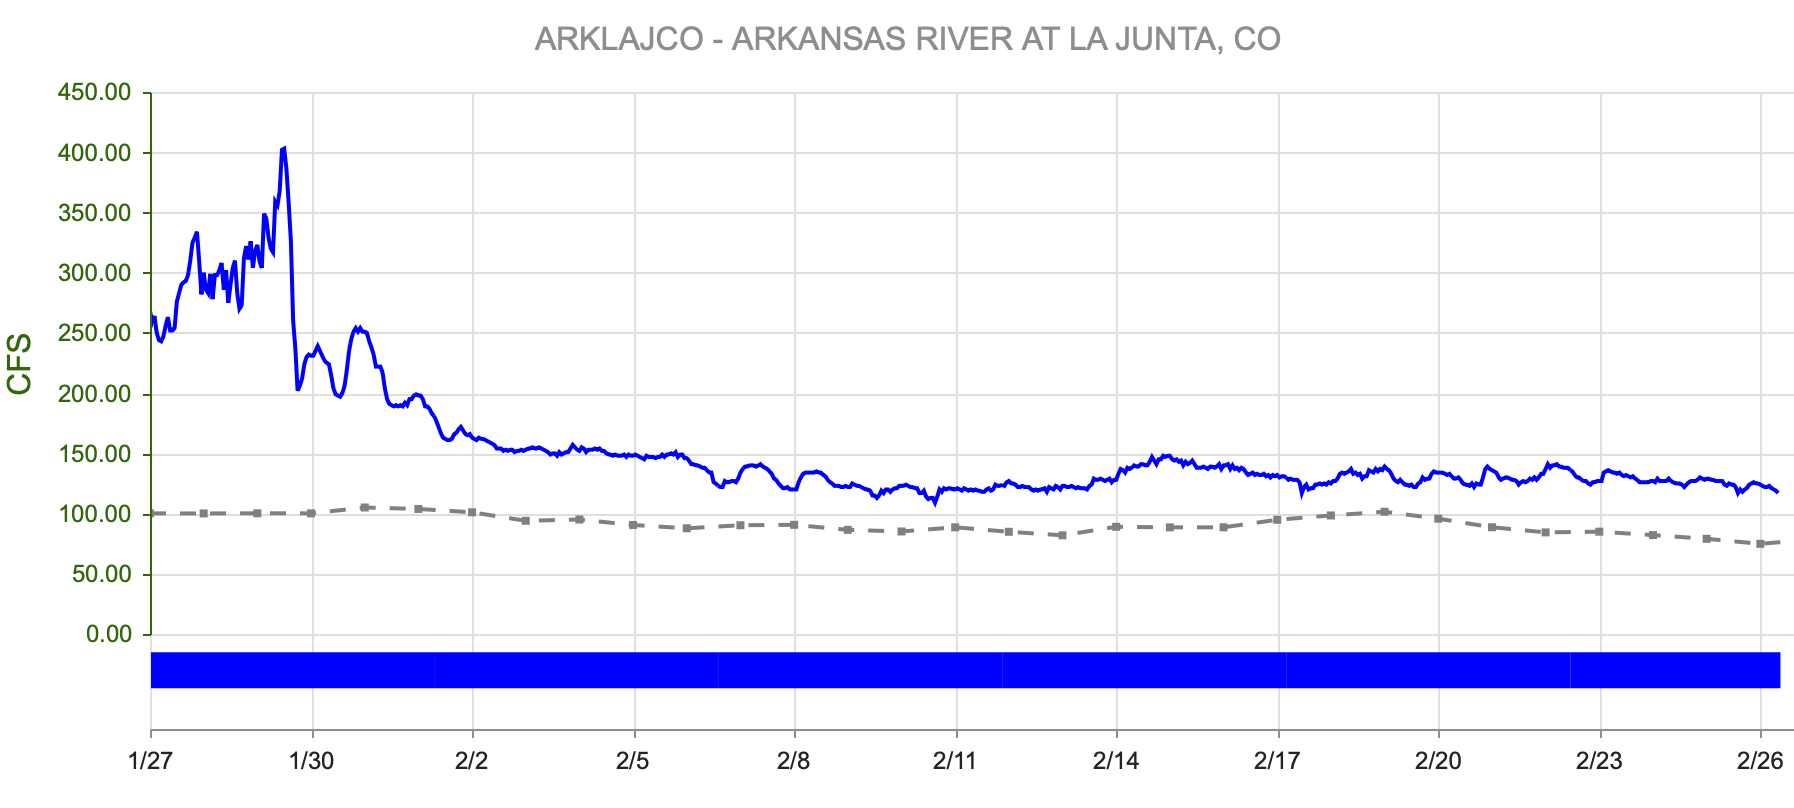

figure 16: Streamflow Forecast
Streamflow Snapshot (3/2/2025; 10:00 am)
* measured flow totals include native flows, BOR project water, releases, and exchanges
Granite, CO (8 miles south of Leadville)- 80.1 cfs
Salida, CO- 243 cfs
Wellsville, CO- 248 cfs
Portland, CO (10 miles south of Canon City)- 229 cfs
Pueblo, CO- 80.7 cfs
Avondale, CO- 337 cfs
Lamar, CO- 22 cfs
For current streamflow updates, reference the Colors of Water webpage.
Reservoir Storage
Reservoir storage across larger basins is generally lower than this time last year (figure 17). Pueblo Reservoir is below last year’s level but remains near median for this point in the season (figure 18).

figure 17: Reservoir Storage Compared to 2025

figure 18: Reservoir Storage Percent of Median
Seasonal Outlook
The March outlook favors warmer-than-average temperatures statewide, with a tilt toward drier-than-average conditions in southwest Colorado, though the precipitation signal remains weak (figure 19; figure 20). The first couple of weeks of March may trend wetter than average in the northern portion of the state, and drier than average in the southern portion (figure 21) The broader spring outlook carries high confidence in warmer- and drier-than-average conditions (figure 22).

figure 19: Three Month Temperature Outlook

figure 20: Three Month Precipitation Outlook

figure 21: 7-Day Forecast

figure 22: Seasonal Drought Outlook
The National Interagency Fire Center Significant Wildfire Potential Outlook predicts above-normal significant wildfire potential for southeastern Colorado beginning in March. Current outlooks from NOAA suggest that areas not presently in drought are likely to enter drought conditions by the end of spring.

figure 23: Significant Wildfire Potential Outlook
La Niña conditions are fading, with ENSO-neutral conditions expected to dominate through spring and early summer. By mid-February 2026, La Niña in the equatorial Pacific is weakening rapidly. The latest plume outlook from the **International Research Institute for Climate and Society** indicates only about a 4% chance that La Niña persists through February–April, while ENSO-neutral conditions are strongly favored at roughly 96%.
Neutral conditions remain the most likely outcome through March–May (around 90%) and April–June (about 65%). After that, probabilities begin shifting toward El Niño. By May–July, El Niño becomes the most likely phase, with odds in the 58–61% range, while ENSO-neutral ranks second.
Although La Niña typically brings drier conditions to southern Colorado and stronger snowpack to the northern mountains, this winter has not followed that pattern cleanly. Forecast confidence for late spring generally improves as we move through March.

figure 24: ENSO Predictions
Want to Learn More? Check out these resources below!
Monitoring
Drought Monitoring: US Drought Monitor
Drought Forecast: National Weather Service Climate Prediction Center
Precipitation Totals: Community Collaborative Ran, Snow, and Hail Network’s Precipitation Mapping System.
Snowpack: Natural Resources Conservation Service
Winter Water Storage System (only applicable until march): Southeastern Colorado Water Conservancy District
Precipitation: https://www.cocorahs.org/
Arkansas River Daily Report – http://www.div2waterops.com/dailyreports
Arkansas Streamflow: http://www.div2waterops.com/ColorsOfWater
Snow Survey and Water Supply Forecasting: Natural Resource Conservation Service Snow Survey
Additional monitoring resources:
Colorado Water Conservation District/Department of Natural Resources
Definitions
30 Year Running Average: When we present the monthly flows, we compare them to that month’s median flows from the last 30 years (referred to as 30 year running average).
Reservoir Percent Full: The Bureau of Reclamation considers a reservoir “full” when pool elevation is at the top of the active conservation pool. Percentage is therefore based on total reservoir volume below that level.
Educational Resources
Administrative Call Explained: DWR
Citizen’s Guide to Colorado Water Law: CFWE Education
Non-Attorney’s Guidebook to Colorado Water Courts: Co State
Voluntary Flow Management
- https://arkvalleyvoice.com/ahra-says-arkansas-river-flows-are-high-and-fast-making-safety-paramount/
- https://coloradotu.org/arkansas-river
U.S. Climate Normals: https://www.ncei.noaa.gov/products/land-based-station/us-climate-normals
